Assignments must be typed and submitted before the start of class on the due date.
Read the article below and answer the following questions:
By MARK MAREMONT
Staff Reporter of THE WALL STREET JOURNAL, August 18, 2000
In an unusual transaction, the chief executive of Lernout & Hauspie Speech Products NV recently paid a 34% premium to buy 625,000 shares of the company's stock from one of its founders.
The transaction, which was revealed in just-released regulatory filings, took place July 27. Gaston Bastiaens, CEO of the Belgian provider of speech-recognition software, bought the shares for $40 apiece that day, or a total of $25 million. L&H stock closed that day at $29.88 in 4 p.m. trading on the Nasdaq Stock Market, after trading between $28.50 and $31.
A company spokesman said Mr. Bastiaens bought the stock in a private transaction from Jo Lernout, one of the firm's two founders. According to the filings, Mr. Bastiaens increased his stake to 1.54 million shares. The shares Mr. Lernout controls declined to 21.73 million, according to the filing, or about 16% of the shares outstanding as of the recent quarter's end.
Craig Columbus, CEO of InsiderScores.com, a Phoenix Web site that tracks stock trading by insiders, called the above-market transaction "very unusual" and said he couldn't recall a similar case. Given the normal trading volume in L&H stock, he said, "you could go into the market and probably buy 600,000 shares in a couple of days" at much lower prices.
Mr. Columbus said, however, that buying at such a premium "sends a clear, strong signal" the executive is bullish on the firm's future stock performance.
The L&H spokesman, who declined to be identified by name, said Mr. Lernout was interested in selling some of his stake to continue his financing of a Belgian nonprofit that promotes the development of speech-recognition technology. At the same time, he said, Mr. Bastiaens was "bullish" on the stock, and interested in adding to his position. The two men had been discussing a private deal earlier in July, the spokesman said, when the stock was "closer" to the $40 level.
Asked why Mr. Bastiaens purchased stock in a private transaction, the spokesman said release of the company's second-quarter earnings was less than two weeks away, and Mr. Bastiaens was restricted from purchasing shares in the open market. Mr. Bastiaens paid a big premium, the spokesman said, in part because he knew second-quarter earnings would be "good," and he "wanted to avoid any appearance of impropriety, of taking advantage of a sweetheart deal."
On Aug. 8, L&H reported a net loss of $33.7 million, or 26 cents a share, compared with net income of $9.6 million, or eight cents a diluted share, a year earlier. Earnings excluding goodwill and one-time items of five cents per share were two cents above Wall Street expectations.
The L&H spokesman said the stock bought by Mr. Bastiaens came from an entity through which Mr. Lernout and co-founder Pol Hauspie control L&H. The co-founders will continue to vote the 625,000 shares now owned by Mr. Bastiaens.
Mr. Bastiaens borrowed the entire purchase price "at market rates" from Belgium's Artesia Banking Corp., the spokesman said. Artesia has been a lender to L&H, having helped the company fund its recent purchase of Dictaphone Corp.
On Aug. 8, the same day L&H earnings were released, the company's shares tumbled 19% to $29.81 after an article in The Wall Street Journal raised questions about discrepancies in the company's claims of sales to certain customers in South Korea. The article noted that L&H disputed the Journal's findings.
L&H stock has rebounded in recent days. At 4 p.m. Thursday on the Nasdaq, L&H shares rose $2.13 to $35.38.
1. You are an investment advisor who has been approached by a client for help on his financial strategy. He has $250,000 in savings in the bank. He is 55 years old and expects to work for 15 more years, making $80,000 a year. (He expects to make a return of 8% on his investments for the foreseeable future. You can ignore taxes.)
Once he retires 15 years from now, he would like to be able to withdraw $60,000 a year for the following 25 years. (His actuary tells him he will live to be 95 years old.) How much would be need in the bank 15 years from now to be able to do this?
Because of family demands, your client does not expect to be able to save more than $2,000 a year for the next five years. Assuming that he keeps to this savings schedule, how much would he have to save over the following ten years in order to be able to afford to withdraw $60,000 a year during retirement, as planned?
Assume that it is now five years from the events described in the initial paragraph. (Continue to assume that your client will save $2000 a year for the first five years.) Contrary to the expected return of 8% on investments, the stock market has crashed and expected returns are only 5%. In order to be able to continue to withdraw $60,000 a year during retirement, how much more will your client have to save over the next ten years?
If your client insists on saving no more than was originally planned (in part b.), how much would he be able to withdraw each year during retirement?
2. Go to http://www.zacks.com. Pick any stock that you are interested in, that has positive earnings per share, and that pays dividends. Pick any one analyst, and use his/her earnings estimates. Assume that the EPS estimate for the coming year is correct, and that the estimated 5-year growth rate is correct. If the estimated 5-year growth rate is greater than 6%, assume that growth will taper off to 6% per year after 5 years. If not, assume that growth will continue at the estimated rate forever.
Go to Yahoo or another similar site, and find out the dividends paid on the stock last year. Compute the ratio of dividends per share to earnings per share last year (this is called the dividend payout ratio). Assume that this payout ratio will remain constant forever.
Go to Yahoo or another site and find the stock's beta. Go to Bloomberg or another similar site, and find the yield on 1 year Treasury bills. Use the following formula to compute the required rate of return on your stock:
Required rate of return (in % p.a.) = 1 year T-bill yield + 5.5 (Stock beta)
Using your computed dividend estimates and required rate of return, compute the price of the stock. (Keep in mind when dividends will be paid.) Is your estimate too high or too low? Can you explain the difference? Document all the web sources that you used to obtain your information.
An excellent source for financial statement information is the Library home page; this location is very useful because you can download the information in Excel format, and you can get up to 10 years worth of information. In order to obtain the data, go to http://library.pace.edu; click on Databases; choose the Disclosure database from the bottom option (Please choose a database). Enter the ticker name for AT&T (T) and choose either the Global 10-K history or the U.S. 10-K history options to download the data in Excel format. (You can also find the information at http://biz.yahoo.com/reports/financials.html; however, it is not downloadable.)
1. Get stock price data from http://chart.yahoo.com/d/ for the period from February 1995 to February 2000 for Sun Microsystems (ticker symbol SUNW), Cisco Systems (CSCO) and Wal-Mart Stores, Inc. (WMT) in a spreadsheet format. Use the last column of the data (titled Adj. Close) to compute monthly returns. Then compute the expected returns and standard deviations of returns for different portfolio proportions of SUNW and CSCO, then SUNW and WMT; and then CSCO and WMT. Also compute the portfolio proportions of the absolute minimum variance portfolio for each of the three pairs of stocks. Next, plot on a single graph, the (E(R), s) combinations for all three pairs of assets. Show the minimum variance portfolios on your graph.
Answer the following questions:
(You can find an file containing an example of portfolio construction with two assets on my webpages.)
2. Download stock price data from http://chart.yahoo.com/d/ for IBM (ticker symbol IBM) for the period December 1978 to December 1983 in a spreadsheet format. Use the last column of the data (titled Adj. Close) to compute monthly returns. Download index data for the S&P 500 from Economagic for the same period. Use regression to compute the beta for IBM (in Excel). Now use data for the period December 1993 to December 1998 to compute IBM's beta again. Then look up the beta number provided for IBM on Yahoo. Answer the following questions:
(Old stocks for Q. 1: ROCK, IPS and FDY; Time period: August 1994 to August 1999; use new stocks unless you're specifically okayed to use old stocks.)
Answer the questions posed on the final exam for Fall 1999.
First of all, since control is power, and hence is worth money, the price of a large potentially controlling interest is greater than the worth of the shares by themselves. Secondly, since the market for shares of a single company is not that liquid, any individual who wants to sell a large block must accept a lower than market price, and any individual that wants to buy a large block must be willing to pay a higher than market price. Even though according to Mr. Columbus, “Given the normal trading volume in L&H stock, he said, "you could go into the market and probably buy 600,000 shares in a couple of days" at much lower prices,” that may not be possible for somebody as visible as Mr. Bastiaens. Furthermore, anonymity would, to some extent, defeat the purpose of the purchase, if it was to send a signal to the market.
To the extent that the shares of the company are concentrated in a few hands, there might be undue power in the hands of those shareholders. This bodes ill for minority shareholders.
Perhaps Mr. Bastiaens is aware of the appearance of impropriety. He might have wanted to show the market that he is sufficiently confident about the future of the company, yet allay fears regarding misuse of his increased control of the company.
Yes, there is the possibility of a conflict of interests. Mr. Bastiaens might have to take steps in the future to allay doubts about his objectives.
Problem 1.
| Year | Cashflow (at year end) (in thousands) | Present Value (at 8%) | Value at the end of year 15 (at 8%) |
| 0 | 250 | 250 | 25 x 3.172 = 793.042 |
| 1-15 | 80 | 80 x 8.559 = 684.758 | 684.758 x 3.172 = 2172.1682 |
| 16-40 | 60 | 60 x 10.6748/(1.08)15 = 201.9081 | 201.9081 x 3.172 = 640.4866 |
Present values of annuities are computed using the annuity formula (for example in the last two rows of the table; column 3); 3.172 is simply equal to (1.08)15
a. The answer from the above table is 640.4866.
b. The already available $250 will grow to $793.042; so no more additional saving is necessary. From part (a), we know that on ly $640.4866 is required at the end of yr. 15 (when he is 70). He can even dissave. How much can he dissave (or consume in excess of his salary) during the fifteen years? Suppose he chooses to dissave $x per year. Then, we need PV(annuity of x per year for 15 years at 8%) = (793.042-640.4866)/(1.08)15. Solving, we find x = $5.6185
c. It's five years from the beginning of the events described. The $2 that the client saved each year would have amounted to PV(annuity of 2 per year for 5 years at 8%) x (1.08)5 = 11.7332 and the initial 250 would have grown to 367.332, for a total of 379.065. From this point on, the monies will grow at 5%. So these already accumulated funds will grow to 379.065(1.05)10 = 617.457 by the time the client retires. Now, he will need $60 per year for the next 25 years. It's value at the time of retirement can be computed as PV(annuity of 60 per year for 25 years at 5%). This works out to 845.63667, which is greater than the 617.457, which the client has accumulated. Hence, he needs to plan to save $y every year for the next ten years, such that PV($y per year for 10 years at 5%)(1.05)10 = (845.63667 - 617.457). Solving, we find 18.141328 a year.
d. If, on the other hand, the client only wants to save $2 per year for the next 10 years, he would have 617.457 + PV(annuity of $2 for 10 years at 5%)(1.05)10 = 617.457 + 25.15579. Equating this to the present value of an annuity of $x for 25 years at 5%, we find $x = $45.595 a year.
Problem 2:
Suppose we pick GE. Go to http://www.zacks.com and pick the first Institutional Broker, who has EPS estimates of $3.70 for 2000. The estimated five-year growth rate is 15%.
From http://biz.yahoo.com/p/g/ge.html, we see that dividends last year were $1.64, with earnings of $3.22 for a payout ratio of approximately 50%. (Keep in mind that earnings are year-to-date, while dividends seem to be for the last fiscal year (somewhat unclear from the information provided on the site.) The stock beta is given as 1.16. The return on 1 year T-bills (http://www.bloomberg.com/markets/C13.html?sidenav=front) as of Feb. 8, 2000 is 6.19%.
Using this payout ratio, dividends next year would be 3.70/2 = 1.85 next year and is expected to grow at 15% for the next five years, with growth tapering off to 6%, as provided for in the question.
The required rate of return is given by 6.19 + 1.16(5.5) = 12.57%
Discounting the dividends for the next 5 years using the information generated, we have a present value of 8.5796. Dividends at the end of the sixth year would be 1.85(1.15)4(1.06) = 3.4298. Discounting the value (at the end of year 5) of the dividends from the future that would be expected to grow at 6% p.a., we get 3.4298/(.1257 - 0.06) = 52.204. Discounting the value to the beginning of year 1, we have 52.204(1.1257)5 = 28.8795. Adding in the 8.5796, we get an estimated stock price of $37.46. The actual stock price at 11 am on Feb. 8, 2000 was $138!
We assumed that all dividends on a yearly basis, starting one year from now, i.e. as of Feb. 8, 2001. In practice, GE pays dividends four times a year starting in March. We would need to adjust our computations for this. However, the estimated price and the actual price are far apart! How are we to explain this?
1. Here are the expected returns and the standard deviations of returns for the three stocks:
|
SUNW |
CSCO |
WMT |
|
|
exp. Ret |
0.07438 |
0.066445 |
0.028305 |
|
stdev. |
0.128537 |
0.105321 |
0.089955 |
Here is the variance-covariance matrix:
| SUNW | CSCO | WMT | |
| SUNW | 0.016522 | 0.008032 | 0.002278 |
| CSCO | 0.008032 | 0.011093 | 0.001675 |
| WMT | 0.002278 | 0.001675 | 0.008092 |
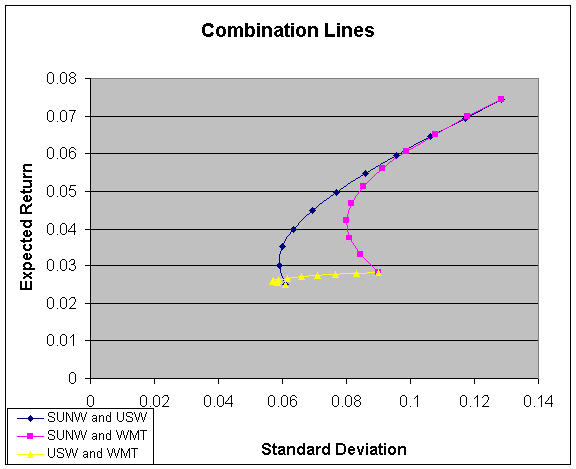
The tables below show the expected returns and the variances for the portfolios that can be constructed by taking the stocks, two at a time. The chart below graphs the combination lines.
|
Portfolios with SUNW and WMT |
||||
|
Proportion in SUNW |
WMT |
Exp ret |
var. |
stdev. |
|
0 |
1 |
0.028305 |
0.008092 |
0.089955 |
|
0.1 |
0.9 |
0.032913 |
0.00713 |
0.084437 |
|
0.2 |
0.8 |
0.03752 |
0.006569 |
0.081046 |
|
0.3 |
0.7 |
0.042128 |
0.006409 |
0.080054 |
|
0.4 |
0.6 |
0.046735 |
0.00665 |
0.081546 |
|
0.5 |
0.5 |
0.051343 |
0.007292 |
0.085395 |
|
0.6 |
0.4 |
0.05595 |
0.008336 |
0.091301 |
|
0.7 |
0.3 |
0.060558 |
0.009781 |
0.098897 |
|
0.8 |
0.2 |
0.065165 |
0.011627 |
0.107826 |
|
0.9 |
0.1 |
0.069773 |
0.013874 |
0.117786 |
|
1 |
0 |
0.07438 |
0.016522 |
0.128537 |
|
Portfolios with CSCO and WMT |
||||
|
Proportion in CSCO |
WMT |
Exp ret |
var. |
stdev. |
| 0 | 1 | 0.028305 | 0.008092 | 0.089955 |
| 0.1 | 0.9 | 0.032119 | 0.006967 | 0.083468 |
| 0.2 | 0.8 | 0.035933 | 0.006159 | 0.078477 |
| 0.3 | 0.7 | 0.039747 | 0.005667 | 0.075279 |
| 0.4 | 0.6 | 0.043561 | 0.005492 | 0.074108 |
| 0.5 | 0.5 | 0.047375 | 0.005634 | 0.075059 |
| 0.6 | 0.4 | 0.051189 | 0.006092 | 0.078052 |
| 0.7 | 0.3 | 0.055003 | 0.006867 | 0.082869 |
| 0.8 | 0.2 | 0.058817 | 0.007959 | 0.089213 |
| 0.9 | 0.1 | 0.062631 | 0.009367 | 0.096786 |
| 1 | 0 | 0.066445 | 0.011093 | 0.105321 |
|
Portfolios with SUNW and CSCO |
||||
|
Proportion in SUNW |
CSCO |
Exp ret |
var. |
stdev. |
| 0 | 1 | 0.066445 | 0.011093 | 0.105321 |
| 0.1 | 0.9 | 0.067239 | 0.010596 | 0.102937 |
| 0.2 | 0.8 | 0.068032 | 0.01033 | 0.101639 |
| 0.3 | 0.7 | 0.068826 | 0.010296 | 0.101469 |
| 0.4 | 0.6 | 0.069619 | 0.010492 | 0.102432 |
| 0.5 | 0.5 | 0.070413 | 0.01092 | 0.104498 |
| 0.6 | 0.4 | 0.071206 | 0.011578 | 0.107602 |
| 0.7 | 0.3 | 0.072 | 0.012468 | 0.111659 |
| 0.8 | 0.2 | 0.072793 | 0.013588 | 0.116568 |
| 0.9 | 0.1 | 0.073587 | 0.014939 | 0.122227 |
| 1 | 0 | 0.07438 | 0.016522 | 0.128537 |
a. If I had not yet computed the portfolio variances for different portfolio combinations,
and I wanted to minimize portfolio variance to the greatest extent,
I would choose CSCO and WMT, because they have the smallest pairwise covariance, and their own variances are also small.
b. You can decrease the standard deviation of returns of a portfolio consisting of two stocks below the standard deviations of returns of either stock by itself by choosing two stocks that have low correlation and picking the appropriate combination of both stocks. The portfolio standard deviation can be raised beyond the standard deviation of returns of either asset simply by weighting one stock sufficiently heavily.
2.
Regression of RIBM on RS&P500 using return data for 1979-1983
|
Regression Statistics |
||||||
|
Multiple R |
0.557787248 |
|||||
|
R Square |
0.311126614 |
|||||
|
Adjusted R Square |
0.299249487 |
|||||
|
Standard Error |
0.046555226 |
|||||
|
Observations |
60 |
|||||
|
ANOVA |
||||||
|
|
df |
SS |
MS |
F |
Significance F |
|
|
Regression |
1 |
0.056775717 |
0.056775717 |
26.19544319 |
3.65702E-06 |
|
|
Residual |
58 |
0.125708566 |
0.002167389 |
|||
|
Total |
59 |
0.182484283 |
|
|
|
|
|
|
Coefficients |
Standard Error |
t Stat |
P-value |
Lower 95% |
Upper 95% |
|
Intercept |
-0.000579407 |
0.006338236 |
-0.091414564 |
0.927478186 |
-0.013266756 |
0.012107942 |
|
RIBM |
0.718914152 |
0.140463717 |
5.118148414 |
3.65702E-06 |
0.437745684 |
1.00008262 |
Parts 1., 2.,
The numbers under the rubric "Coefficients" are the most important ones. The statistical model that the regression assumes is:
RIBM,t = intercept + slope(RS&P500) + error.
The estimated value of the intercept is given in the row labelled "Intercept" as -0.000579407. The estimated value of the slope is below that, and is 0.7189. This is the IBM’s beta estimate, and it means that during the sample period, a 1% increase in the market return meant that, on average, IBM’s return increased by 0.72%.
The number under the "standard error" column for that row is 0.14; how do we interpret this? Suppose we could draw lots of 60-observation samples from the assumed underlying normal distribution that generated IBM’s and the market’s returns over that period. Now, if we ran regressions using that data, we would get many beta estimates. If we plotted the frequency distribution for those beta estimates, we would get a normal distribution centered around 0.72 with a standard deviation of 0.14. We can now interpret the last two numbers in the same row as well. What they tell us is that we can say with 95% confidence that the true value of IBM’s beta over that period was between 0.438 and 1.000.
To make more sense of the intercept, we need to make use of the CAPM. The CAPM says that
E(RIBM) = Rf + bIBM(E(Rm)-Rf) = (1- bIBM)Rf + E(Rm)
If we take the expectation of the regression model above, we get
E(RIBM) = intercept + E(Rm)
Comparing the two models, we see that according to the CAPM, the intercept should equal (1- bIBM)Rf; i.e. if the average return on IBM over that period relative to its market risk was as predicted by the CAPM, the estimated intercept should have been (1- bIBM)Rf. This also means that we can use the value of the intercept less (1- bIBM)Rf as a measure of how the stock performed over that period. If we look at average one-year T-bill rates during that period, they were around 9.5%. Using that estimate, the CAPM suggests that the intercept should have been (1-0.72)(.095) = 0.0266, whereas the actual estimate was only -0.00058. Clearly the stock underperformed the market, after adjustment for the beta risk of IBM. Furthermore, if we look at the 95% confidence limits for IBM, we see that the true intercept was reliably less than the intercept required by the CAPM.
Part 3. The beta estimate can be improved in several ways. One would be to combine the estimated beta with the a priori estimate of one, since the average beta of all assets in the market is, by definition, one. Another method would be to take into account the financial leverage and operating leverage of IBM during the period, since financial and operating leverages are important determinants of stock betas.
Regression using return data for 1994-1998
|
Regression Statistics |
||||||
|
Multiple R |
0.571233482 |
|||||
|
R Square |
0.326307691 |
|||||
|
Adjusted R Square |
0.314692306 |
|||||
|
Standard Error |
0.069882609 |
|||||
|
Observations |
60 |
|||||
|
ANOVA |
||||||
|
|
df |
SS |
MS |
F |
Significance F |
|
|
Regression |
1 |
0.137192994 |
0.137192994 |
28.09271504 |
1.87524E-06 |
|
|
Residual |
58 |
0.283247584 |
0.004883579 |
|||
|
Total |
59 |
0.420440578 |
|
|
|
|
|
|
Coefficients |
Standard Error |
t Stat |
P-value |
Lower 95% |
Upper 95% |
|
Intercept |
0.01232967 |
0.009997292 |
1.233300966 |
0.222438497 |
-0.007682069 |
0.03234141 |
|
RIBM |
1.205925099 |
0.227522042 |
5.300256129 |
1.87524E-06 |
0.750490591 |
1.661359608 |
Part 4. The beta estimate provided by Yahoo as of Friday, March 24 was 1.06. This is different from 1.20. However, it is interesting to note that 1.06 is within the 95% confidence limits. Furthermore, if we took an average of 1.20 and the a priori estimate of one, we would get a beta estimate closer to 1.06. Yahoo also uses data for the last five years to estimate its beta; hence the difference is probably simply due to a slightly different dataset.
Part 5., and 6.
The beta for IBM has increased from the early 80s to the late 90s. The reason for this is most likely that IBM has changed from being a staid, utility-like company that mainly leased out mainframes to a company that is very much a technology-based "New Economy" company that does very well when the economy is doing well, but has much significantly prospects when the economy is not doing well.