|
Midterm I
- The midterm is closed book. However, you are allowed to bring in one 8.5"x11" sheet, containing anything you wish.
- Time allowed is 1.5 hours.
- Explain all your steps; correct answers without explanations may not be given any credit at all.
- Show all your computations and formulae. Make all your assumptions explicit. If your approach is correct, you will get some credit, even if your arithmetic answer is wrong. So concentrate on getting your logic right.
- If you answer a question, I have the discretion to award you some points, even if you are completely wrong. If you don't attempt the question at all, I can give you no points! So attempt every question.
1. (35 points) Read the following article and answer the following question:
Your friend, Andrea, is confused by the events of Friday, February 18, 2000. "Normally bond prices and stock prices move in tandem," she says. "I understand why bond prices rose; that's because inflation is clearly under control. But why didn't stock prices?" What do you have to say to her? Using your answer to her conundrum, analyze the events of Friday in a concise manner.
Industrials Skid As Rate Worries Spark Sell-Off
By ANDREW FRASER, INTERACTIVE WSJ, Monday, February 21, 2000
Stocks skidded Friday in a broad sell-off as investors ignored tame inflation data and focused on comments a day earlier by Federal Reserve Chairman Alan Greenspan that implied more interest-rate increases are in the pipeline.
Bond prices rose, benefiting from a rush by investors to seek safety from tumbling stocks, and the dollar strengthened.
The Dow Jones Industrial Average sank to its lowest level in four months, skidding 295.05 points to 10219.52, its second-worst point drop this year. At its worst, the blue-chip average showed a loss of 314 points.
It was the average's first close below 10300 since Oct. 21. The drop Friday is topped this year only by a 359.58 tumble on Jan. 4. The decline was led by rate-sensitive financial stocks. American Express plunged 10 to 137 15/16, while J.P. Morgan fell 3 3/4 to 109 1/2. The Keefe Bruyette & Woods bank stock index fell 22.14 to 666.78.
Losses were exacerbated by the so-called double-witching, when stock index futures and options expire simultaneously.
This year has been very volatile for blue-chip investors. They have seen the industrial average run up to a new high just a month ago only to be rocked like a rollercoaster, with the swings defined by big point moves. The mood is becoming more pessimistic, with the Dow industrials last Friday slipping into what Wall Street defines as a correction, or a 10% drop from its high.
Meanwhile, worries about rising rates also fueled profit-taking in the highflying technology sector and among small stocks. The tech-rich Nasdaq Composite index sank 137.17 to 4441.75, while the Russell 2000 small-stock index fell 12.74 to 545.68. Both indexes had closed at record levels on Thursday as investors shunned blue-chip stocks for shares of aggressively growing technology and small companies.
Among technology issues, Microsoft dropped 4 9/16 to 95 1/16; International Business Machines fell 4 1/8 to 112 5/8; Ebay lost 7 1/8 to 138 1/8; Yahoo fell 7 1/16 to 156 1/8.
The Standard & Poor's 500-stock index lost 42.17 Friday to 1346.09 and the New York Stock Exchange Composite Index fell 14.59 to 586.67.
The mood of the market was decisively negative, with declining stocks on the Big Board outnumbering advancers by more than three to one. Volume was brisk as investors scurried to square away positions ahead of a three-day holiday weekend. U.S. financial markets will be closed Monday for Presidents Day.
Investors also had to deal with snowy weather in New York and a computer glitch that kept the Nasdaq Stock Market from updating numbers for its bellwether composite index and some other indexes for several hours.
Tame inflation data failed to alleviate worries stoked by Mr. Greenspan's comments on Thursday. Investors also are growing more nervous about the high levels of some stocks -- especially technology and some select blue-chip issues. The Dow industrials are struggling to find some footing.
With the index dropping further on Friday, the downward momentum has begun to spiral. Charles White, portfolio manager at Avatar Associates, said the Dow industrials break below the 10300 level is important to the psyche of the market. "The Dow is teetering at levels that are sort of the last levels of support -- the last stop before 10000 and below," he said.
Investors were focused on the economy Friday and interest rates, but the conflicting economic data were insufficient to form any concrete opinions about whether the economy is cooling off enough to avoid aggressive credit tightening by the central bank. They are on higher alert because of Mr. Greenspan's most recent comments.
Mr. Greenspan, in testimony Thursday to Congress on the state of the economy, left investors with a feeling that the central bank is poised to raise rates even more this year to keep inflation at bay, although some players felt the signal wasn't for an aggressive tightening. The Fed has raised rates four times in the last eight months.
Nevertheless, Avatar's Mr. White said investors have priced in an increase of 0.90 percentage points by September on the federal funds rate, which banks charge each other for overnight loans. "When you see that, there is a growing perception that we see will see a change from quarter point increases to increases up to half point," he said.
But Mr. White said that at some point political pressure will force the Fed "to stop fighting an invisible enemy." Indeed, inflation has remained relatively mild despite the economy's longest-on-record expansion. But Fed policy makers are worried that the tight labor market and strong consumer spending will eventually push up prices.
In economic news Friday, the government reported that consumer prices rose at a smaller-than-expected pace in January, another indication that inflation remains tame, and that the U.S. trade gap narrowed in December.
The Labor Department said its consumer price index rose 0.2% in January, the same rate as in each of the previous three months and smaller than the 0.3% gain that Wall Street had expected. Core prices, which exclude the volatile food and energy sectors, accelerated as expected to a 0.2% rate, twice the rate in December.
The modest price increase provided scant comfort to financial markets, however, since investors have already factored in another interest-rate increase by the Fed next month.
In addition, the consumer price index has decreased in importance now that Mr. Greenspan indicated he is not using the number to forecast inflation. Bill Meehan, market strategist at Cantor Fitzgerald, said the number has "no basis in reality."
Mr. Meehan noted that investors were more interested in U.S. trade-balance data released early Friday, which showed the U.S. international trade deficit narrowed in December even as the trade gap for the year widened to a record.
The Commerce Department said the trade deficit unexpectedly shrank to $25.55 billion, as exports grew at more than twice the pace of imports. December's improvement in the trade picture was muted somewhat by a substantially revised upward estimate for November's gap, to $27.10 billion from the initially reported $26.50 billion.
The December trade news defied analysts' expectations of a deficit at about November's level, providing a boost to the dollar in currency markets, as a lower trade gap lessens the dependency of the U.S. economy on foreign investors for financing.
2. (35 points) Danny bought 1200 shares of AOL for $55. He did not have enough money to pay for his entire purchase. Hence he borrowed $20000 from his broker. If the broker's usual initial margin requirement was 50%, how many shares altogether could Danny have bought if he had chosen to take full advantage of the buying on margin privileges? To what level can the stock price drop before Danny would be liable for a margin call, if the maintenance margin is 30%? If, instead of dropping, AOL rose to $60, how much money would his broker allow Danny to take out of his account? (I.e., how much could he take out without violating the usual margin requirements?)
3. Here's some information on Treasury bill rates as of mid-afternoon February 22, 2000. One day is allowed for settlement. 2000 is a leap year.
Maturity |
Days to Mat. |
Bid |
Asked |
Chg |
Ask Yield |
Mar 02 '00 |
8 |
5.28 |
- |
|
5.28 |
Mar 09 '00 |
15 |
5.27 |
5.19 |
-0.01 |
5.27 |
- If, on February 22, 2000, you had bought Treasury bills maturing on March 2, 2000, with a combined face value of $20,000, how much would you have had to pay? (10 points)
- If, on February 22, 2000, you had sold Treasury bills maturing March 9, 2000, with a face value of $40,000, how much would you have received? (10 points)
- If you had received the March 9 bill seven days ago in return for a payment of $39,800, what would your effective annual return be on the transaction? (10 points)
Solutions to Midterm I
1. The sentence "Bond prices rose, benefiting from a rush by investors to seek safety from tumbling stocks" clearly indicates the writer's belief that there was a flight to quality; i.e the risk premium has increased. As such, even though interest rates dropped, required rates of return for stocks have gone up and stock prices dropped. As to why interest rates dropped, one might point to the fact that inflation rates have indeed dropped as indicated by the first paragraph, and as believed by Andrea. Even though there is a lot of discussion in the article about possible inflation in the future and what Mr. Greenspan might do to prevent it, the simplest explanation is that the market is not incorporating future inflation fears in its pricing of Treasury bonds. Rather, Greenspan's actions, both current and potential, seem to increasing market uncertainty, and hence increased required rates of return (and concomitantly, lower prices) on stocks.
2. Danny bought securities worth 1200 x 55 = $66,000, but he borrowed only $20,000. Hence his equity is $46,000, and his actual margin is 46,000/66,000 = 69.7%. If he wanted to, since he clearly had 46,000 of his own, he could have borrowed another $46,000, and he could have purchased 92000/55 = 1672.73 shares in all.
To find out when he would be subject to a margin call, we solve AM = Equity/Mkt. Val. of Securities or 0.30 = (1200P - 20000)/1200P. Solving, we find P = $23.81.
If the price went up to $60, he could withdraw any amount over and above the initial margin requirement of 50%. The equity requirement would have to satisfy 0.50 = Equity/Mkt. Val. of securities, or 0.50 = Equity/1200x60, or equity = $36000. In fact, he has equity of 1200x60 - 20000 = $52,000. Hence he could withdraw $52000 - $36000 = $16,000.
3. a. If you're buying T-bills you have to buy them at the ask rate; since the Banker's Discount rate is not given, we use the ask yield of 5.28. The price, P, solves [(100-P)/P](365/8) = 0.0528. Solving, we find that the price is 99.88441 per $100 of face value. To buy bills with a face value of $20,000, we would pay 20,000 x 0.9988441 = $19,976.88
b. If you're selling T-bills, you have to sell them at the bid rate. The Banker's Discount bid rate = 5.27%. The price P solves [(100-P)/100](360/15) = 0.0527. Solving, we find that the price is $99.78042 per $100 of face value. If you sold bills with a face value of $40,000, you would receive 40000 x 0.9978042 = $39,912.17.
c. If you had bought these bills at $39,800 seven days ago, the effective annual return would be (39,921.17/39,800)(365/7) = 15.806%.
Midterm II
- Time allowed is 2 hours.
- Explain all your steps; no credit for correct answers without explanations.
- Show all your computations and formulae. Make all your assumptions explicit. If your approach is correct, you will get some credit, even if your arithmetic answer is wrong. So concentrate on getting your logic right.
- If you answer a question, I have the discretion to award you some points, even if you are completely wrong. If you don't attempt the question at all, I can give you no points! So attempt every question.
- Read the following article by Jason Booth from the Wall Street Journal of 3/27/2000 and answer the questions that follow:
Pakistani Stocks Have Soared More Than 70% Since October in Wake of a Military Takeover
Who says a coup d'etat is bad for the market? Five months after Pakistan's military seized power, Karachi's stock market is booming: The KSE 100 index has risen more than 70% since October, making it Asia's best-performing market this year.
Even as President Clinton visited Pakistan during the weekend and pressed for a return to democratic rule, analysts maintain the stock market's recent success is directly related to improved sentiment following the military takeover.
Despite red tape that foreign investors say can delay repatriation of funds, the market has been buoyed by hope that the military government can reduce the alleged corruption and bureaucratic cronyism many felt hobbled efforts to deal with Pakistan's economic difficulties.
"Internationally, there was a negative reaction" to the coup, says Farrukh Sabzwari, Credit Lyonnais country manager in Karachi. "But in Pakistan, there is the realization it is what we needed. Economically, we were at our lowest ebb."
In particular, the financial markets have applauded the appointment of Shaukat Aziz, who formerly headed Citibank's global private-banking operation, as finance minister. "In the previous government, there were so many political appointments that it was hard to expect any economic progress," says Saqib Masood, an analyst at Jardine Fleming in Karachi. "Because the new government has brought in technocrats, people feel the economy can get back on track."
President Clinton's visit also has helped lift the market in recent weeks, analysts say, because it is seen as acceptance of the new regime by the international community. At the same time, closer relations between Pakistan and the U.S. should prompt the government to focus more on economic and social issues than military affairs.
"The market perceives that the visit will prod the government to put more money toward [economic] development," says Arshad Arif, ABN Amro First Capital equity strategist. If the government is serious about focusing on economic development, it will be likelier to ease military tensions on Pakistan's border with India, he says. "The military realizes that Pakistan can't afford a war at this time, so they will try to improve the economy before they take action on that front."
While politics sparked the rally, economic factors have fanned it. The price of cotton, Pakistan's largest export, has rebounded strongly since the start of the year after two years of steady declines. Because Pakistani cotton farmers enjoyed a bumper crop in 1999, they have reaped significant benefit from the gain.
The most popular and most liquid stocks in Pakistan represent three of the country's biggest industries: Pakistan State Oil, Hub Power Co., the country's largest energy company, and Pakistan Telecom, whose shares have gained about 60% this year.
Stocks have become one of the few desirable investments for Pakistanis. Domestic interest rates have fallen by almost half during the past two years, making interest-bearing investments less attractive. The exchange rate between the Pakistani rupee and the U.S. dollar has remained relatively stable for months, making foreign-currency speculation difficult. Investing in property, meanwhile, looks about to become a lot less popular because of pending bankruptcy reforms that will make it easier for banks to seize the personal assets of debtors, primarily property holdings.
But while domestic investors alone have driven Pakistan's rally so far, it may require an influx of foreign investment to sustain further strong gains. The bad news for Karachi, however, is that regional fund managers say they aren't buying Pakistan's recovery story.
Brad Aham, who invests in emerging markets for State Street Global Advisors in Boston, is no stranger to risk. But he is steering clear of Pakistan. "Between nuclear testing, coups and the Kashmir conflict, there are a lot of other places we can place our bets," he says.
Besides the quite-obvious political risks, U.S. investors in Pakistan have complained about problems repatriating funds after selling shares. While the situation isn't as bad as in Malaysia, where punishing exit taxes were removed only recently, some investors say they have experienced delays exceeding two months to get their money out of the country.
"We could sell the securities," says Steven Schoenfeld, head of international equity strategy at Barclays Global Investors in San Francisco. "But we never were 100% sure we could immediately repatriate the money."
- Is the price shock caused by potential military takeovers diversifiable risk or non-diversifiable risk? (10 points)
- Comment on the following statement: One should not consider a potential military take-over as a source of risk because military take-overs are good for stocks. (10 points)
- Is the risk of unexpected legislation increasing the cost of repatriating funds after selling shares, such as occurred a few years ago in Malaysia, diversifiable risk or non-diversifiable risk? (10 points)
2. Here are the results of a regression of the returns on Cisco Systems (CSCO) on the returns on a portfolio tracking the S&P 500, using data from February 1994 to December 1999:
Regression Statistics |
|
|
|
|
|
Multiple R |
0.510354 |
|
|
|
|
|
R Square |
0.260461 |
|
|
|
|
|
Adjusted R Square |
0.249743 |
|
|
|
|
|
Standard Error |
0.093309 |
|
|
|
|
|
Observations |
71 |
|
|
|
|
|
|
|
|
|
|
|
|
ANOVA |
|
|
|
|
|
|
|
df |
SS |
MS |
F |
Significance F |
|
Regression |
1 |
0.211581 |
0.211581 |
24.30136 |
5.45E-06 |
|
Residual |
69 |
0.600752 |
0.008707 |
|
|
|
Total |
70 |
0.812332 |
|
|
|
|
|
|
|
|
|
|
|
|
Coefficients |
Standard Error |
t Stat |
P-value |
Lower 95% |
Upper 95% |
Intercept |
0.027427 |
0.012218 |
2.244826 |
0.027988 |
0.003053 |
0.051801 |
RCSCO |
1.387554 |
0.281472 |
4.929641 |
5.45E-06 |
0.826034 |
1.949075 |
- What is the estimated beta of CSCO? (5 points)
- What percentage of the return on CSCO cannot be explained by movements in the S&P 500? (5 points)
- The beta estimation for CSCO over the sample period, April 1990 to Dec. 1993, is given below:
Regression Statistics |
|
|
|
|
|
Multiple R |
0.447362 |
|
|
|
|
|
R Square |
0.200133 |
|
|
|
|
|
Adjusted R Square |
0.181531 |
|
|
|
|
|
Standard Error |
0.121373 |
|
|
|
|
|
Observations |
45 |
|
|
|
|
|
|
|
|
|
|
|
|
ANOVA |
|
|
|
|
|
|
|
df |
SS |
MS |
F |
Significance F |
|
Regression |
1 |
0.158494 |
0.158494 |
10.7589 |
0.002062 |
|
Residual |
43 |
0.633449 |
0.014731 |
|
|
|
Total |
44 |
0.791943 |
|
|
|
|
|
|
|
|
|
|
|
|
Coefficients |
Standard Error |
t Stat |
P-value |
Lower 95% |
Upper 95% |
Intercept |
0.062248 |
0.018806 |
3.309956 |
0.001895 |
0.024321 |
0.100174 |
RCSCO |
1.62435 |
0.495217 |
3.280077 |
0.002062 |
0.62565 |
2.623049 |
The one-year T-bill rate as of the end of Dec. 1993 was 3.61% per annum. What would your required rate of return be on CSCO over the following year (that is, from January 1994 to December 1994), according to the CAPM? Assume a 8% expected rate of return on the market portfolio over and above the one-year riskfree rate the next year. (10 points)
- The five-year constant maturity Treasury rate was 5.15% per annum at the end of December 1993. Assume that the expected rate of return on the market portfolio, itself, for the next five years is 24.8% per annum (not the market risk premium). (This, by the way, was the actual rate of return on the S&P 500 portfolio over the next 5 years.) Using the CSCO beta that is available to you as of December 1993, what would be your annualized required rate of return on CSCO over the next five years (i.e. from January 1994 to December 1998). (10 points)
- Did the true beta risk of CSCO change from the 1990-1993 period to the 1994-99 period? Explain your answer. If you believe it did change, what in your opinion, caused the change? (10 points)
3. (30 points) You have available to you, two mutual funds, whose returns have a correlation of 0.23. Both funds belong to the fund category “Balanced – Domestic.” Here is some information on the fund returns for the last six years (obtained from http://www.financialweb.com/funds/):
Year |
Capital Value Fund |
Green Century Balanced |
Year |
Capital Value Fund |
Green Century Balanced |
1999 |
21.32% |
-10.12% |
1996 |
21.48% |
18.26% |
1998 |
21.44% |
18.91% |
1995 |
0.91% |
-4.28% |
1997 |
9.86% |
24.91% |
1994 |
10.79% |
-0.47% |
average |
14.30% |
7.87% |
|
|
|
stdev |
8.52% |
14.57% |
|
|
|
In addition, you can also invest in a riskfree 1-year T-bill yielding 6.286%. The expected return on the market portfolio is 20%.
- If you have a risk aversion coefficient of 4, and you have a total of $20,000 to invest, how much should you invest in each of the three investment vehicles? (10 points)
- What is the standard deviation of your optimal portfolio? (10 points)
- Now assume that you have the alternative of investing in any portfolio that you desired, without any restriction. Would you continue to invest in the portfolio that you just constructed in part a. (call it the balanced portfolio)? If your answer is yes, explain why. If your answer is no, I will give you a further choice: I will add x% to the expected return of the balanced portfolio. For what value of x, would you be be just willing to invest in the balanced portfolio? (10 points)
Solutions to Midterm 2
1. a. The price shock due to the coup d'etat clearly affects the entire Pakistani economy; hence for Pakistani investors who may legally find it difficult to diversify outside Pakistan, the shock is non-diversifiable. For global investors, it is clearly diversifiable, since the military takeover would not have broad, global implications. However, a military takeover, say, in a country like the US (as we have seen in several alarmist movie scenarios) would have global implications, and such a risk would be non-diversifiable to a greater extent.
1. b. Risk derives from uncertainty. Hence, to the extent that we are not sure of the precise impact of the military takeover, there is uncertainty and hence risk. Furthermore, it is not possible to predict beforehand the occurrence of a military takeover, which also generates uncertainty, and hence potential risk (qualified by the answer to 1.a.)
1.c. The answer to this is similar to that of 1a., as far as global investors are concerned. However, for Malaysian investors the risk is a second order risk, since they do not have to worry about repatriation of funds. On the other hand, the reduction in foreign demand for Malaysian stocks might affect the value of Malaysian investor portfolios. It is also necessary to take into account the possibility that repatriation legislation in one country might spawn similar legislation in neighboring countries, or a whole geographical area. This would then move the risk closer to a non-diversifiable risk for global investors.
2. a. The estimated beta can be read out from the Coefficients column as 1.387554, or approximately 1.39.
2. b. The R2 of a regression measures the proportion of the variance of the dependent variable that can be explained by the independent variable. Hence, in this case, the percentage of the return on CSCO that cannot be explained by movements in the S&P 500 is 1 - 0.260461 or approximately 74%.
2. c. Required ROR = 0.0361 + 1.624(0.08) = 16.60%
2.d. Required ROR = 0.0515 + 1.624(0.248 – 0.0515) = 37.06%
3. Using the formula, we can find the portfolio weights for the tangent portfolio of risky assets:  which works out to 1641.13/1529.31 = 1.073. Hence wGCB = 1-(1.073) = -0.073. which works out to 1641.13/1529.31 = 1.073. Hence wGCB = 1-(1.073) = -0.073.
In order to find the optimal combination of the tangent portfolio and the riskfree asset for our investor, we need to compute the expected return on the tangent portfolio and the variance of portfolio returns.
E(Rtgtport) = 1.073(14.3) + (-0.073)(7.87) = 14.77%
Var(Rtgtport) = (1.073)2(8.52)2 + (-0.073)2(14.57)2 + 2(-0.073)(1.073)(8.52)(14.57)(0.23) = 82.47. Hence,. stgtport = 9.08%
Using the formula y* = [E(Rport) – Rf]/0.01AVar(Rtgtport), we get y* = 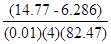 = 2.57; hence the proportion in the riskfree asset is -1.57. In other words, the investor borrows to invest in the tangent portfolio. = 2.57; hence the proportion in the riskfree asset is -1.57. In other words, the investor borrows to invest in the tangent portfolio.
If the investor’s total outlay is $20,000, the amount borrowed equals (20000)(1.57) = $31,400. This provides a total of $51,400 for investment in the tangent portfolio. However, the tangent portfolio itself consists of shortselling Green Century Balanced to the extent of (0.073)(51,400) = 3752.20, providing a total of 51,400 + 3752.2 - $55,152.20 for investment in Capital Value Fund.
3. b. The standard deviation of the optimal portfolio is 2.57(9.08) = 23.34%. The expected return on the optimal portfolio is 2.57(14.77) + (-1.57)(6.286) = 28.09%
3.c. We are told that the market portfolio has an expected return of 20%. If we were to be investing in the market portfolio and the riskfree asset, as would be optimal in the absence of insider information and/or special non-trading restrictions, we would use the formula y* = [E(Rport) – Rf]/0.01AVar(Rtgtport) to come up with the portfolio proportions. However, in this case, we do not have information on the variance of the market portfolio. On the other hand, we do have information on the variance of returns of two balanced portfolios, which are supposed to resemble to some extent, the market portfolio. We can use this information to estimate the variance of returns on the market portfolio. If we take the average of these two numbers, we get a market portfolio variance estimate of (14.572 + 8.522)/2 = 142.44, which gives us a market standard deviation estimate of 11.93%.
Applying the formula now, we get y* = 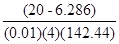 = 2.51, with the portfolio weight for the riskfree asset being –1.51. This would generate a portfolio expected return of 2.51(20) +(-1.51)(6.286) = 40.67%. The portfolio variance would be (2.51)2(142.44) = 897.39 for a portfolio standard deviation of 29.96%. = 2.51, with the portfolio weight for the riskfree asset being –1.51. This would generate a portfolio expected return of 2.51(20) +(-1.51)(6.286) = 40.67%. The portfolio variance would be (2.51)2(142.44) = 897.39 for a portfolio standard deviation of 29.96%.
How can we compare this portfolio with the balanced portfolio constructed earlier? The utility function gives us a way. The utility for the balanced portfolio is E(R) - 0.005A(Var(R)) = 28.09 – (0.005)(4)(23.34)2 = 17.19. The utility for the optimal portfolio based on the market is 40.67 – (0.005)(4)(897.39) = 22.72, which has a utility of 22.72 - 17.19 = 5.53 greater than that of the balanced portfolio. Since the utility function is linear in the expected return, this could be offset by adding 5.53 percentage points to the expected return of the balanced portfolio. Hence the appropriate value of x = 5.53.
- Time allowed is 2 hours.
- Explain all your steps; no credit for correct answers without explanations.
- Show all your computations and formulae. Make all your assumptions explicit. If your approach is correct, you will get some credit, even if your arithmetic answer is wrong. So concentrate on getting your logic right.
- If you answer a question, I have the discretion to award you some points, even if you are completely wrong. If you don't attempt the question at all, I can give you no points! So attempt every question.
1. Here is some T-bill rate information from the Wall Street Journal Interactive edition, as of May 5, 2000 (http://interactive.wsj.com/documents/mktindex.htm?tsyquote.htm). Quotes are from mid-afternoon of Friday, May 5, 2000. Treasury bill quotes are in hundredths, quoted in terms of a discount rate. Days to maturity are calculated from settlement date. All yields are based on a one-day settlement and calculated on the asked quote.
Maturity |
Days
to
Mat. |
Bid |
Asked |
Chg |
Ask
Yield |
May 11 '00 |
3 |
5.27 |
5.19 |
+0.05 |
5.26 |
May 18 '00 |
10 |
4.86 |
4.78 |
-0.10 |
4.85 |
May 25 '00 |
17 |
5.05 |
4.97 |
-0.02 |
5.05 |
Aug 10 '00 |
94 |
5.88 |
5.87 |
+0.05 |
6.04 |
Nov 9 '00 |
185 |
6.08 |
6.07 |
+0.08 |
6.35 |
- Use the ask yields to compute the 1-week forward rates 3 days ahead and 10 days ahead. Also compute the 13-week forward rate 94 days ahead. Express the forward rates as effective annual yields, and then as ask yields. (25 points)
- What, do you think, is the market's expectation regarding the rate on the 13-week T-bill to be issued on Aug. 10? Make any additional assumptions that you consider necessary. (You may not assume that the market makes unbiased forecasts of future rates.) (10 points)
2. Here is an article from the Interactive edition of the Wall Street Journal of May 5, 2000.
Treasury Bond Prices Decline Amid Interest Rate Worries
By MICHAEL S. DERBY, Dow Jones Newswires
NEW YORK -- U.S. Treasury prices fell Friday, ending one of their worst weeks in over a year as the market began bracing for the strong possibility that the Federal Reserve will raise interest rates by half a percentage point this month to stifle any threat of inflation.
The price of the 10-year note fell 1/2, or nearly $5 for every $1,000 in face value, to 99 31/32. The note's yield, which moves inversely to its price, rose to 6.494%.
The 30-year Treasury bond dropped 13/32, or more than $3.75 for a bond with $1,000 face value, to 100 27/32, yielding 6.183%. The two-year note fell 3/32 to 99 7/32, yielding 6.803%.
- The coupon on the 30 year Treasury bond is 6.25%. Use this information, and the other information in the article to estimate the duration of the 30-year Treasury bond, as of May 5, 2000. Assume that coupons are paid semi-annually. (10 points)
- The coupon on the 10 year Treasury note is 6.5%. Use this information, and the other information in the article to estimate the duration of the 10-year Treasury note as of May 5, 2000. Assume that coupons are paid semi-annually. (10 points)
- Estimate the duration of the 30 year Treasury bond as of May 5, 2000, using the information on price and yield changes from yesterday to today. Note that the yield on the 30 year T-bond was about 6.155 yesterday. (10 points)
- Estimate the duration of the 10 year Treasury note as of May 5, 2000, using the information on price and yield changes from yesterday to today. Note that the yield on the 10 year note was about 6.398 yesterday. (10 points)
- Using your answers from parts a. and b., answer the following question: How much higher, do you think, is the volatility of returns on the 30-year Treasury bond, compared to the volatility of returns on the 10-year Treasury note? Make all your assumptions explicit. (10 points)
- Use the duration estimate from part b. to estimate the price change in the 10-year Treasury note for the actual change in the note yield from May 4 to May 5. Compare this to the actual price change. Now, assuming that the price change can be computed exactly using both duration and convexity, estimate the convexity of the 10-year Treasury note. (15 points)
Solutions to Final
1. a. The formula relating ask yields to prices is given by 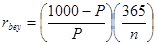 ; substituting, we find ; substituting, we find
Maturity |
Ask
Yield |
Price |
May 11 '00 |
5.26 |
999.5679 |
May 18 '00 |
4.85 |
998.673 |
May 25 '00 |
5.05 |
997.6535 |
Aug 10 '00 |
6.04 |
984.6832 |
Nov 9 '00 |
6.35 |
968.8186 |
a. Hence the one-week forward rate three days ahead equals (999.5679/998.673)365/7 = 1.04781 or 4.781%. Using the ask yield formula, the rate would be [(999.5679/998.673)-1](365/7) = 4.672%.
The one-week forward rate ten days ahead can be computed similarly as (999.5679/997.6535)365/14 = 1.05125 or 5.125%.
The 13-week forward rate 94 days ahead can be computed as (984.6832/968.8186)365/91 = 1.06732 or 6.732%.
b. If we assume that the liquidity premium is 50 basis points, then the market’s expectation of the future 91-day rate is 6.732 – 0.5 or 6.232%.
2.
- Using the formula,
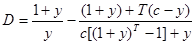 , we can find the duration of the 30 year bond. In this case, c = .0625/2, T = 30 x 2, y = .06183/2. In this case, the duration works out to 27.925 half years or 13.9625 years. Note that this computation assumes that the bond has fully 30 years to go. , we can find the duration of the 30 year bond. In this case, c = .0625/2, T = 30 x 2, y = .06183/2. In this case, the duration works out to 27.925 half years or 13.9625 years. Note that this computation assumes that the bond has fully 30 years to go.
- The duration of the 10 year note is 14.9483 half-years, or 7.474 years, again assuming that the note has a full 10 years to maturity.
- The quoted price of the 30-year bond dropped 13/32 or 0.40625. However, the actual price includes the coupon payment. Over the one day, the coupon component of the invoice price would increase by (0.0625)(100/365) or 1.71 cents. Thus, the total price drop equals 0.40625 – 0.017 or 0.3891. Using the information on price and yield changes, the duration of the 30 year bond can be calculated as [(0.3891)/(0.06183-0.06155)]*(1.06155/103.408) = 14.266 years. Note that the bond price as of May 5, 2000 would have been 100 27/32 + 13/32 plus the accrued coupon of 2.1575 (0.0625x100x126/365) = 103.408. The computed duration here is smaller, probably due to the fact that the note has less than a full thirty years to maturity.
- The quoted price of the 10-year note dropped 16/32 or 0.5. However, the actual price includes the coupon payment. Over the one day, the coupon component of the invoice price would increase by (0.065)(100/365) or 1.71 cents. Thus, the total price drop equals 0.5 – 0.01781 or 0.4822. Using the information on price and yield changes, the duration of the 10 year note can be calculated as [(0.4822)/(0.06494-0.06398)]*(1.06398/102.713) = 5.203 years. Note that the note price as of May 5, 2000 would have been 99 31/32 + 16/32 + the accrued coupon of 2.2438 (0.065x100x126/365) = 102.713.
- If the yield on the 10 year note were as volatile as the yield on the 30 year bond, then percentage returns on the 30-year bond would be 13.9625/7.474 or 1.868 (the ratio of durations) times as volatile as the returns on the 10 year note. However, if the yield on the 10 year note were 25% more volatile than the yield on the 30 year bond, then the percentage returns on the 30 year bond would only be 1.868/1.25 = 1.4945 or about one and a half times as volatile as returns on the 10 year note.
- The formula relating price change and duration and convexity is given by the formula DP/P = -D(Dy)/(1+y) + 0.5 (Convexity) (Dy)2. Using the values P = 102.713, DP = -0.4822, D = 7.474, Dy = 0.06494-0.06398 = 0.00096, 1+y = 1.06398, we can solve for Convexity. In this case, it works out to 4446.51.
|
|