3. (http://webpage.pace.edu/pviswanath/class/647/exam/fal08exa.html) 3. Looking through various 10Ks, it is possible to collect the following information (in millions of dollars):
3 mths ended 7/31 |
9 mths ended 7/31 |
Yr ended 10/31 |
|||
Sales and revenues |
2008 |
2007 |
2008 |
2007 |
2007 |
Sales of manufactured products, net |
3,879 |
2,852 |
10,592 |
8,802 |
11,910 |
Finance revenues |
75 |
104 |
265 |
292 |
385 |
Sales and revenues, net |
3,954 |
2,956 |
10,857 |
9,094 |
12295 |
Costs and expenses |
|||||
Costs of products sold |
3,115 |
2,428 |
8,762 |
7,505 |
10,131 |
Selling, general and administrative expenses |
386 |
368 |
1,071 |
1,010 |
1461 |
Engineering and product development costs |
108 |
86 |
289 |
284 |
382 |
Interest expense |
88 |
125 |
357 |
367 |
502 |
Other income, net |
-5 |
-34 |
-10 |
-21 |
-34 |
Total costs and expenses |
3,692 |
2,973 |
10,469 |
9,145 |
12,442 |
Equity in income of non-consolidated affiliates |
18 |
22 |
63 |
62 |
74 |
Income before income tax |
280 |
5 |
451 |
11 |
-73 |
Income tax expense |
-8 |
-9 |
-17 |
-28 |
-47 |
Net income (loss) |
272 |
-4 |
434 |
-17 |
-120 |
Basic earnings (loss) per share |
3.85 |
-0.05 |
6.16 |
-0.24 |
-1.7 |
Diluted earnings (loss) per share |
3.68 |
-0.05 |
5.92 |
-0.24 |
-1.7 |
Net Capital for Navistar, as of 7/31/2008 and 10/31/2007 were $1603m. and $1633m. The latest data for 2008 that are available are as of July 31. (Net Capital was computed from available 10K data as the sum of Net Debt and Shareholder's Equity.)
(http://webpage.pace.edu/pviswanath/class/648/exam/spr06exa.html) Here are three articles from the BBC website. The first one is from April 13, the second from April 28, and the third from May 4, 2006. Read the articles carefully and answer the questions that follow:
Mitchells & Butlers spurns offer
13 April 2006
The pub group behind the All Bar One and Harvester chains has rejected
an informal £2.7bn takeover approach from a private equity consortium.
Mitchells & Butlers (M&B) said it would not consider a takeover
until it got a formal written offer from the R20 group, led by tycoon
Robert Tchenguiz. The consortium said that M&B had refused to discuss
any deal. News of the 550p per share approach sent M&B shares up 7.3%
to 497.5p by the close of Thursday trading.
Formal offer
The pub chain emerged as a potential takeover target for Mr Tchenguiz
in March, and the Takeover Panel had given him until 8 May to make a formal
bid or walk away. R20 said that its offer for M&B would be funded
through a mix of equity and debt, and said it could fully fund the pub
group's pension deficit. It said it would make the bid formal if it was
allowed to undertake further due diligence work and get approval from
its financing banks and consortium members. It also needed the M&B
board to recommend its offer to shareholders.
According to the Financial Times, R20 has been told to come back with
an offer of at least 600p a share, valuing the pub group at £2.94bn.
M&B operates more than 2,000 sites and was created when former Bass
company Six Continents demerged its hotels and retail divisions in 2002.
M&B confirms Beefeater interest
28th April 2006
Pub and restaurant chain Mitchells & Butlers has confirmed reports
it is considering buying 250 Beefeater and Brewers Fayre outlets from
Whitbread.
Mitchells & Butlers (M&B) made the announcement as it unveiled
a 4.3% rise in quarterly sales, and said it could return up to £500m
to investors. Whitbread said on Tuesday that it was selling the under-performing
sites. M&B owns the Harvester and All Bar One chains. Earlier this
month it rejected a private equity takeover approach. The £2.7bn
offer on 13 April came from the R20 group, led by tycoon Robert Tchenguiz.
Debt increase?
M&B chief executive Tim Clark said on Friday morning that the planned
£500m return of capital to investors could be scaled back if it
buys the Whitbread assets, which are valued at £450m. Investment
bank Morgan Stanley said that M&B might choose to buy the Beefeater
and Brewers Fayre outlets by raising its debts, thereby still allowing
it to return between £250m to £300m to shareholders.
M&B's like-for-like second quarter sales rose 4.3% in the 13 weeks
to 22 April, an increase on the 4% rise seen in the first quarter, it
said in a trading update. The company operates more than 2,000 sites and
was created when former Bass company Six Continents demerged its hotels
and retail divisions in 2002.
Pub group M&B snubs bid approach
Thursday, 4 May 2006
Pub and restaurant group Mitchells & Butlers has rejected a £2.7bn ($4.97bn) takeover approach from a consortium led by tycoon Robert Tchenguiz. M&B, which owns the Harvester and All Bar One chains, said the offer undervalued the business. The group operates about 2,000 outlets across the UK. M&B emerged as a potential bid target for Mr Tchenguiz in March, and the Takeover Panel had given him until 8 May to make a formal bid or walk away.
Bid defence
M&B's board met to consider the 550-pence-per-share offer from Mr
Tchenguiz's R2O consortium on Wednesday night. The R2O offer proposed
combining M&B's pub estate with that of the Laurel Pub Company, which
is owned by Mr Tchenguiz and includes the Yates's chain of wine bars.
However, setting out its reasons for rejecting the approach, M&B said its like-for-like sales - a measure which strips out the impact of new outlets - had grown at the fastest rate in the sector over the past two years. It added that sales had risen by 4.1% in the first 29 weeks of the current financial year.
"The board believes that the company has excellent prospects for organic growth and is well placed to take advantage of further consolidation opportunities," the company said.
Questions:
1. (15 points) What connections can you make between the different articles?
Focus on strategies that can be employed by targets in a hostile takeover;
use theories/analyses developed in class and in the text.
2. (15 points) Comment on the structure of the offer made by R2O for M&B.
3. Here are the closing prices (see below) for M&B stock (from Reuters):
a. (10 points) You need to perform a bargaining range analysis. What date would you use to compute the bargaining range?
R2O is a consortium and is not traded on any exchange. However, treat column 3 as the price per share of R2O, also quoted in pence on the London Stock Exchange, for the purpose of this question (100 pence make a pound(£)). MAB had 490.57 million shares outstanding. Assume that R2O had 540m. shares outstanding. For the purpose of this question, use the closing prices for April 3, 2006. You are told that the parties have estimated the value of the combined firm to be £4.492b.
b. (10 points) What is the amount of the estimated synergy?
c. (10 points) What is the minimum exchange ratio that would be acceptable to MAB shareholders, assuming that they do not have any alternative to R2O’s offer (other than going it alone)?
d. (10 points) What is the maximum exchange ratio that R2O would be willing to offer?
Trade Date |
M&B |
R2O |
|
3-May-06 |
516 |
357.056 |
|
02May06 |
482.25 |
355.6 |
|
28Apr06 |
492.25 |
344.4 |
|
27Apr06 |
495.25 |
351.904 |
|
26Apr06 |
501.75 |
360.976 |
|
25Apr06 |
509 |
360.752 |
|
24Apr06 |
504.25 |
361.424 |
|
21Apr06 |
504 |
358.064 |
|
20Apr06 |
500 |
357.28 |
|
19Apr06 |
490.25 |
353.136 |
|
18Apr06 |
490 |
349.552 |
|
13Apr06 |
497.5 |
348.544 |
|
12Apr06 |
463.5 |
346.752 |
|
11Apr06 |
479.75 |
349.328 |
|
10Apr06 |
490 |
349.328 |
|
07Apr06 |
486 |
349.104 |
|
06Apr06 |
481.5 |
356.384 |
|
05Apr06 |
482 |
353.92 |
|
04Apr06 |
484.25 |
345.968 |
|
03Apr06 |
485 |
351.68 |
4. (20 points) Suppose MAB believes that demand for beer worldwide will be rising over the next year, and, as such, it demands a higher price for its shares. R2O does not believe that this is so. If this is the main source of disagreement between MAB’s management and R2O, how can they come to an agreement?
2. (http://webpage.pace.edu/pviswanath/class/649/exam/exasum06.html)
2. At 10:09 p.m. on June 14, 2006, the following
rates were shown on http://www.ozforex.com.au.
EUR/USD
|
1.2616
|
1.2621
|
GBP/USD
|
1.8462
|
1.8467
|
EUR/GBP
|
0.6829
|
0.6834
|
The EUR/USD forward rate for 3 months was
3 Months
|
1.268590
|
1.270240
|
The GBP/USD forward rate for 3 months was
3 Months
|
1.848100
|
1.850710
|
2. (http://webpage.pace.edu/pviswanath/class/649/exam/exafal05.html)
2. Read the following article and answer these questions:
THE GREAT THRIFT SHIFT
Economist, Sep 22nd 2005
America is spending while the rest of the world is saving. But for how long? Zanny Minton Beddoes investigates
ON MARCH 10th 2005, Ben Bernanke—a former Princeton professor who at the time was a governor of America's central bank—addressed a gathering of economists in Richmond, Virginia, on America's gaping current-account deficit. Its causes, he argued, were to be found abroad rather than in American profligacy. In particular, Mr Bernanke mused, the world might be suffering from a “global saving glut”. The phrase immediately caught on. Like the famous remark about “irrational exuberance” by Alan Greenspan, the chairman of the Federal Reserve, it has since helped to shape the global economic debate.
The idea's appeal lies in the way it ties together two of the most vexing questions about today's economic landscape: why are interest rates so low? And why can America borrow eye-popping amounts from foreigners with seeming impunity? According to the IMF's latest World Economic Outlook, the global economy will grow by 4.3% this year, slower than in 2004 but still a healthy clip. Strong economic growth is normally accompanied by higher interest rates, but long-term interest rates are at their lowest levels since the 1960s.
At the same time Americans are spending over $700 billion a year more than their economy produces, the equivalent of more than 6% of annual output. As a share of America's economy, this external deficit has more than doubled since 1999. Yet it has had none of the dire consequences for the dollar that Cassandras have been predicting. For the first six months of 2005, the greenback was rising. Although it has slid in recent weeks, the drop has hardly been dramatic.
A “global saving glut” could explain both oddities. If savings are somehow super-abundant, the usual relationship between a strong economy and higher interest rates may no longer hold. And if the spare cash is mainly abroad, that should allow America to finance its deficit with ease. Rather than signalling American profligacy, the current-account deficit might simply be the counterpart to foreign thrift.
This idea turns much conventional economic wisdom on its head. Policymakers usually worry about too little rather than too much thrift. With populations ageing, the broad consensus has been that people need to build up nest eggs to finance their retirement. Economists reckoned that globalisation would lead to a shortage of capital and hence higher interest rates as millions of Indian and Chinese workers were absorbed into the world economy. If Mr Bernanke is right, all this will need re-examining.
 His
suggestion that the causes of global imbalances lie elsewhere conveniently
deflects attention from monetary and fiscal decisions made by American
policymakers. It suggests that Mr Greenspan's loose monetary policy and
George Bush's tax cuts are not responsible for the imbalances in the world
economy. That may seem a little self-serving, coming from a man who has
subsequently moved from the Federal Reserve to become chairman of Mr Bush's
Council of Economic Advisers.
His
suggestion that the causes of global imbalances lie elsewhere conveniently
deflects attention from monetary and fiscal decisions made by American
policymakers. It suggests that Mr Greenspan's loose monetary policy and
George Bush's tax cuts are not responsible for the imbalances in the world
economy. That may seem a little self-serving, coming from a man who has
subsequently moved from the Federal Reserve to become chairman of Mr Bush's
Council of Economic Advisers.
Taken at face value, the notion of a global saving glut is not borne out by the facts. “Glut” suggests an unusually large amount, as in a summer glut of strawberries. In fact, figures published in the IMF's latest World Economic Outlook show that the rate of global saving as a proportion of global output, measured at market exchange rates, has mostly been heading downhill over the past 30 years, with a particularly steep plunge between 2000 and 2002 (see chart 1). Although it has since risen slightly, the global saving rate is now close to its average for the past two decades, rather than unusually high.
In search of a glut
 But Mr Bernanke's argument is more subtle. He is saying that low interest
rates imply too much saving relative to the amount people want to invest,
and that the rising imbalance between America and the rest of the world
suggests the discrepancy is concentrated outside America. A falling global
saving rate could mask substantial divergence between regions. And even
with the saving rate falling, there could be a glut of thrift if the demand
for the use of those savings, ie, the demand for investment, was falling
even faster. The important factors in the equation, therefore, are shifts
in the appetite for investment as well as in the geography of thrift.
But Mr Bernanke's argument is more subtle. He is saying that low interest
rates imply too much saving relative to the amount people want to invest,
and that the rising imbalance between America and the rest of the world
suggests the discrepancy is concentrated outside America. A falling global
saving rate could mask substantial divergence between regions. And even
with the saving rate falling, there could be a glut of thrift if the demand
for the use of those savings, ie, the demand for investment, was falling
even faster. The important factors in the equation, therefore, are shifts
in the appetite for investment as well as in the geography of thrift.
On both counts the world has seen big changes. Traditionally, most of the saving in an economy is done by households, whereas most of the investing tends to be done by firms. But in the past few years firms have become net savers as their profits have exceeded their investments. That change has been most pronounced and long-lasting in Japan, where corporate saving soared after the bubble economy collapsed in the early 1990s. Burdened with bad debts after a period of massive overinvestment, Japanese firms have been net savers for a decade.
The late 1990s saw a similar shift in many emerging Asian economies, where corporate investment plunged after the Asian financial crisis. After the stockmarket bubble burst in 2000, American and European firms' investment also fell. Although American firms began investing again a couple of years ago, the level of corporate investment is still relatively low, given how strongly the economy—and profits—have been growing. Firms in industrial countries as a whole are still saving more than they invest, despite record profits (see chart 2). The only significant country bucking the trend is China, where investment has been rising sharply. But saving has been growing faster still.
A weak appetite for investment might help explain low interest rates, but not the rising imbalances between America and the rest of the world. To understand those, two other factors have to be considered: differences in countries' economic structures, and differences in policymakers' reactions to the investment bust.
America is at one extreme. Its corporate thrift shift was smaller than that of Japan or other Asian economies, but policymakers in Washington reacted far more dramatically. Between 2001 and 2003, America enjoyed its biggest fiscal stimulus of the post-war period, and short-term interest rates were slashed. Declining interest rates fuelled a boom in house prices, encouraging people to borrow against their properties. Economic growth remained strong and the current-account deficit soared.
 Asia's
emerging markets faced a much bigger bust, and had fewer policy tools
to deal with it. After the 1997-98 financial crisis, investment fell by
ten percentage points of GDP. Unable to slash interest rates for fear
of further capital flight, they suffered serious recessions. That left
exports as their main source of growth. To protect exports and to build
up vast war chests of reserves, many East Asian governments kept their
currencies cheap for years after the financial crises. Firms stayed reluctant
to invest, the saving surpluses remained large and the foreign-exchange
reserves piled up.
Asia's
emerging markets faced a much bigger bust, and had fewer policy tools
to deal with it. After the 1997-98 financial crisis, investment fell by
ten percentage points of GDP. Unable to slash interest rates for fear
of further capital flight, they suffered serious recessions. That left
exports as their main source of growth. To protect exports and to build
up vast war chests of reserves, many East Asian governments kept their
currencies cheap for years after the financial crises. Firms stayed reluctant
to invest, the saving surpluses remained large and the foreign-exchange
reserves piled up.
Japan and Europe lie between those two extremes. Politicians in Tokyo tried stimulative policies and talked of structural reform, but proved notoriously ineffective at dealing with their investment bust. The economy fell into deflation and Japan, already the world's biggest exporter of savings, became an even bigger one. Its current-account surplus rose from 1.4% of GDP in 1996 to 3.7% last year.
In Europe, the record has been mixed. Some countries, such as Germany, resemble Japan, with rising saving surpluses and weak domestic demand. Others look more like America. In Britain, fiscal and monetary policy became looser. Spain's current-account deficit is almost as big as America's. Broadly, the countries that saw the biggest rises in house prices also saw the biggest drops in saving.
In short, a good part of the rising imbalances of the past few years can be explained by a series of investment busts—after periods of overinvestment—and sharp differences in the way policymakers responded to them. But particularly since 2000, two other factors have also become important: more saving in China, and the soaring price of oil.
China's investment rate, at 46% of GDP, is the world's highest by far and has been rising fast, but its saving rate has been rising even faster. Between 2000 and 2004, China's national saving rate rose by an extraordinary 12 percentage points of GDP to 50% of GDP. The country has kept its currency cheap and exported ever more capital to the rest of the world.
At the same time, high oil prices have brought a financial windfall to the world's oil exporters which so far they seem to have chosen to save rather than spend. As a group, the oil-exporting countries are now the biggest counterparts to America's current-account deficit (see chart 3).
These shifts have been large and complicated, and they have had important and unusual consequences. The first is that capital now flows primarily from poor countries to rich countries. In 2004, emerging economies, including the newly industrialised economies of East Asia, sent almost $350 billion to rich countries. Yet according to the economic textbooks, capital seeking the highest returns should flow from rich (and capital-intensive) countries to poorer ones that have less of it.
The second consequence is that outside China, less saving by households rather than investment by firms has become the engine of global economic growth. The world economy continues to hum because consumers, particularly American ones, are content to become ever more indebted. That willingness appears closely related to the rapid rise in house prices across much of the globe.
These patterns are a long way from historical norms. Can they last? In the long term, the answer is clearly no. Household saving cannot keep on falling, and America's foreign borrowing cannot keep on rising. The question is when and how the tide might turn.
One camp argues that the saving glut Mr Bernanke has identified is a temporary and largely cyclical phenomenon. As investment recovers in Japan and Europe and strengthens further in America, interest rates will rise. If the investment recovery is concentrated outside America, the surplus savings sloshing in its direction may quickly dwindle. If foreign investors then start fretting about America's dependence on foreign funds, those savings could drain away even more rapidly, sending the dollar down sharply and interest rates up. That would be the classic “hard landing” commentators worry about.
But a growing group of analysts now suggests that the “saving glut” is the result of long-term structural shifts and is likely to last for years, perhaps decades. Some argue that ageing populations in rich countries will mean lower interest rates, because older economies with mature workforces will need less capital and their citizens will save more in preparation for retirement. Others reckon that the Asian economies will continue to export their savings for many years, for mercantilist reasons (keeping their currencies cheap to create jobs in export industries) as well as demographic ones (China, for instance, is ageing faster than America).
If the “saving glut” really is here to stay, there are two main possibilities. The first is that America's consumers will continue to barrel along and the imbalances between America and the rest of the world will increase further. The second is that Americans themselves will start saving again, perhaps because the housing market falters or because high petrol prices begin to bite. With the rest of the world still determined to save too, that would send the global economy into a tailspin.
2. (http://webpage.pace.edu/pviswanath/class/649/exam/exasum05.html) 2. (20 points) Shown below is the balance sheet of MMM Corporation's subsidiary in Poznan, Poland, on December 31, 1996, denominated in thousands of Polish zloty.
MMM Corporation of Poznan, Poland
December 31, 1996
(In thousands of Polish zloty)
Assets |
Liabilities |
||
| Cash | 250 |
Accounts Payable | 250 |
| Accounts Receivable | 100 |
Short-term Debt | 350 |
| Inventory | 300 |
Long-Term Debt | 550 |
| Real Estate | 450 |
Prepaid Deliverables | 150 |
| Plant | 400 |
Equity |
|
| Equipment | 400 |
Common Stock | 500 |
| Retained Earnings | 100 |
||
| Total | 1900 |
Total | 1900 |
The subsidiary was created in January 1, 1996, so it had been in operation for only one year, and all earnings from 1996 were retained as cash. The exchange rate on January 1, 1996, was $0.35/zloty. The exchange rate on December 31, 1996, was $0.40/zloty. The average exchange rate for the period was $0.36/zloty. The inventory is shown at historical cost. The firm also had one unusual nonmonetary liability: MMM had already collected 150 thousand zloty from a Polish firm that ordered a large amount of supplies, and MMM promised to deliver the supplies within the next year.
3. (http://webpage.pace.edu/pviswanath/class/649/exam/exafal04.html) Mexicana de Cobre had been borrowing from the Mexican government at a high rate. In order to avoid these high borrowing rates, it arranged to borrow $251 million from a consortium of 10 banks at a fixed rate of 11.48%. Here is how the deal was arranged (this case is described in more detail in Managing Financial Risk: A Guide to Derivative Products, Financial Engineering, and Value Maximization by C.W. Smithson, C.W. Smith, Jr., and D.S. Wilford (Chicago: Irwin Professional Publishing); note that the details there differ in some details from the details given here). The picture below was taken from the web at http://www.trinity.edu/rjensen/caseans/133sp.htm#Sogem :
A Belgian company, Sogem, agreed to purchase 3700 tons of copper per month (presumably for the duration of the loan) at the prevailing spot price for copper. However, the payments from Sogem went not to Mexicana de Cobre, but rather to an escrow account in New York. Funds in the escrow account were then used to service the debt, and any residual was returned to Mexicana de Cobre.
2. (http://webpage.pace.edu/pviswanath/class/649/exam/exafal04.html) 2. (30 points) Please answer the questions below based on the following excerpt from The Wall Street Journal of Nov. 9, 2004:
You also have available to you, Honda's corporate profile and some information on Honda's worldwide sales
CORPORATE PROFILE
Established in 1948, Honda Motor Co., Ltd., is one of today's leading
manufacturers of automobiles and the largest manufacturer of motorcycles
in the world. The Company is recognized internationally for its expertise
and leadership in developing and manufacturing a wide variety of products
that incorporate Honda's highly efficient internal combustion engine technologies,
ranging from small general-purpose engines to specialty sports cars.
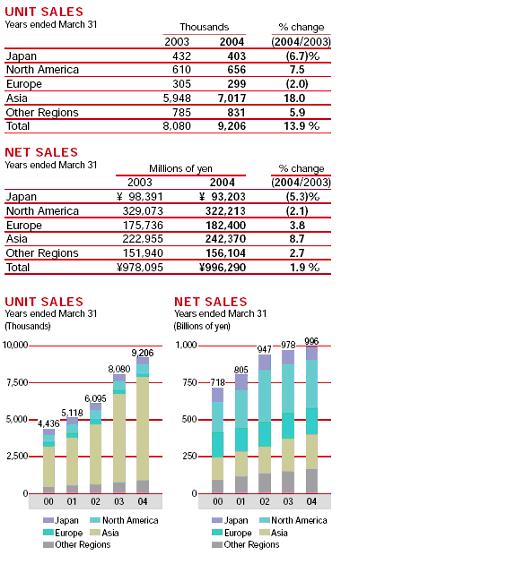
Source: Annual Report, 2004, Honda Motor Co.
WSJ, Nov. 9, 2004: TOKYO (Nikkei)--Honda Motor Co. (7267.TO) will spend about Y30 billion to build a new factory in Georgia that will begin producing automatic transmission systems as early as 2006, the Nihon Keizai Shimbun reported Tuesday.
The construction plan comes as the company is expanding output of automobiles,
such as its Pilot sport utility vehicle and Odyssey minivan, in the neighboring
state of Alabama.
Although the new factory will initially make 100,000 transmissions annually,
output will be increased gradually to between 300,000 and 400,000 units
in step with the pace of automobile production in North America.
Honda's annual vehicle production capacity has reached 1.4 million units in North America. Although the company locally procures almost all of the engines needed to assemble these automobiles, local production of automated transmissions - a key component of vehicles that requires a huge investment in production due to their complicated structure - did not start until 1996. The company currently produces 1 million transmissions annually at its Ohio factory in the U.S. Midwest - in which its major automobile plants are concentrated - and imports the remainder from Japan.
(http://webpage.pace.edu/pviswanath/class/340/exam/fal08exa.html) Kroger Sales Rise 9%; Net Declines on a Charge
Wall Street Journal, December 10, 2008, By David Kesmodel
Kroger Co. said its quarterly profit fell 6.3%, largely because of a charge related to Hurricane Ike, but the supermarket giant's revenue jumped 9% as its low prices and store brands enticed shoppers battered by the U.S. recession.
The Cincinnati-based retailer also increased its earnings guidance for the full year. Its shares were off 6.7% at $25.47 in 4 p.m. New York Stock Exchange composite trading Tuesday, however, because its profit forecast for the current quarter was slightly below analysts' projections. ![[Kroger earnings]](http://s.wsj.net/public/resources/images/MK-AT381_KROGER_NS_20081210003856.gif)
Excluding an after-tax charge equal to three cents a share related to insurance costs for Ike, which damaged Kroger stores, the company said profit would have been $253.6 million, or 39 cents a share.
Analysts had predicted earnings of 38 cents a share and revenue of $17.4 billion, according to a Thomson Reuters survey.
David Dillon, Kroger's chief executive, told analysts in a conference call that he is "feeling pretty good about things, given the environment we're operating in." He said Kroger's strategy of lowering prices, which has reduced its gross margins, "continues to resonate well with customers."
Kroger's same-store sales, a key barometer of the health of grocery stores, rose 5.6%, one of the highest rates in the industry and an improvement from the second-quarter rate of 4.7%. The figures exclude sales of gasoline at stores with fuel pumps.
The retailer's profit partly was damped by higher food inflation, which has affected the grocery industry throughout this year. Kroger said its product-cost inflation in the latest quarter was roughly 6%.
Mr. Dillon also said Kroger "could have done a better job of managing expenses in the quarter."
Kroger is projecting full-year earnings of $1.88 to $1.91 a share, excluding the charge related to the hurricane. It had earlier projected $1.85 to $1.90 a share, while analysts were pegging earnings at $1.92 a share.
The company estimates fourth-quarter profit of 49 cents to 52 cents a share, citing in part expectations for sluggish holiday spending. Analysts had projected earnings of 53 cents a share, according to Thomson Reuters.
_____________________
Here is some additional information:
The following table (from NetAdvantage) provides revenues in millions of dollars for Kroger Co. (fiscal year ending January). Second set of numbers provide growth rate over sales in same quarter, previous year (except for last line).
| 2008 | 2007 | 2006 | 2005 | 2004 | 2003 | 2002 | ||
| 1Q | 20,726 | 19,415 | 17,948 | 16,905 | 16,266 | 15,667 | 15,102 | |
| 2Q | 16,139 | 15,138 | 13,865 | 12,980 | 12,351 | 11,927 | 11,485 | |
| 3Q | 16,135 | 14,999 | 14,020 | 12,854 | 12,141 | 11,696 | 11,382 | |
| 4Q | 17,235 | 16,859 | 14,720 | 13,695 | 13,034 | 12,470 | 12,129 | |
| Year | 70,235 | 66,111 | 60,553 | 56,434 | 53,791 | 51,760 | 50,098 | |
| 2008 | 2007 | 2006 | 2005 | 2004 | 2003 | |||
| 1Q | 6.75% | 8.17% | 6.17% | 3.93% | 3.82% | 3.74% | ||
| 2Q | 6.61% | 9.18% | 6.82% | 5.09% | 3.55% | 3.85% | ||
| 3Q | 7.57% | 6.98% | 9.07% | 5.87% | 3.80% | 2.76% | ||
| 4Q | 2.23% | 14.53% | 7.48% | 5.07% | 4.52% | 2.81% | ||
| Year | 6.24% | 9.18% | 7.30% | 4.91% | 3.92% | 3.32% |
The following table from NetAdvantage provides other details from the Income Statement (in millions of dollars):
| 2008 | 2007 | 2006 | 2005 | 2004 | 2003 | 2002 | 2001 | 2000 | 1999 | |
Revenue |
70,235 |
66,111 |
60,553 |
56,434 |
53,791 |
51,760 |
50,098 |
49,000 |
45,352 |
28,203 |
Operating Income |
3,657 |
3,508 |
3,300 |
3,003 |
3,147 |
3,676 |
3,567 |
3,397 |
3,125 |
1,410 |
Depreciation |
1,356 |
1,272 |
1,265 |
1,256 |
1,209 |
1,087 |
973 |
907 |
961 |
430 |
Interest Expense |
474 |
488 |
510 |
557 |
604 |
600 |
648 |
675 |
652 |
267 |
Pretax Income |
1,827 |
1,748 |
1,525 |
290 |
770 |
1,973 |
1,711 |
1,508 |
1,129 |
713 |
Eff Tax Rate |
35.4% |
36.2% |
37.2% |
NM |
59.1% |
37.5% |
39.0% |
41.6% |
43.5% |
36.9% |
Net Income |
1,181 |
1,115 |
958 |
-100 |
315 |
1,233 |
1,043 |
880 |
638 |
450 |
The table below shows the same information, but with the numbers for each year as a percentage of revenues for that year:
| 2008 | 2007 | 2006 | 2005 | 2004 | 2003 | 2002 | 2001 | 2000 | 1999 | |
| Revenue | 100.00% | 100.00% | 100.00% | 100.00% | 100.00% | 100.00% | 100.00% | 100.00% | 100.00% | 100.00% |
| Operating Income | 5.21% | 5.31% | 5.45% | 5.32% | 5.85% | 7.10% | 7.12% | 6.93% | 6.89% | 5.00% |
| Depreciation | 1.93% | 1.92% | 2.09% | 2.23% | 2.25% | 2.10% | 1.94% | 1.85% | 2.12% | 1.52% |
| Interest Expense | 0.67% | 0.74% | 0.84% | 0.99% | 1.12% | 1.16% | 1.29% | 1.38% | 1.44% | 0.95% |
| Pretax Income | 2.60% | 2.64% | 2.52% | 0.51% | 1.43% | 3.81% | 3.42% | 3.08% | 2.49% | 2.53% |
| Net Income | 1.68% | 1.69% | 1.58% | -0.18% | 0.59% | 2.38% | 2.08% | 1.80% | 1.41% | 1.60% |
CORPORATE OVERVIEW (from NetAdvantage): Kroger is one of the largest U.S. supermarket chains, with 2,486 supermarkets as of February 2008. The company's principal operating format is combination food and drug stores (combo stores). In addition to combo stores, KR also operates multi-department stores, marketplace stores, price-impact warehouses, convenience stores, fuel centers, jewelry stores, and food processing plants. Total food store square footage exceeded 145 million as of February 2008.
Retail food stores are operated under three formats: combo stores, multi-department stores, and price-impact warehouse stores. Combo stores are considered neighborhood stores, and include many specialty departments, such as whole health sections, pharmacies, general merchandise, pet centers, and perishables, such as fresh seafood and organic produce. Combo banners include Kroger, Ralphs, King Soopers, City Market, Dillons, Smith's, Fry's, QFC, Hilander, Owen's, Jay C, Baker's, Pay Less and Gerbes.
Multi-department stores offer one-stop shopping, are significantly larger in size than combo stores, and sell a wider selection of general merchandise items, including apparel, home fashion and furnishings, electronics, automotive, toys, and fine jewelry. Multi-department formats include Fred Meyer, Fry's Marketplace, Smith's Marketplace and Kroger Marketplace. Many combination and multi-department stores include a fuel center.
Price-impact warehouse stores offer everyday low prices, plus promotions for a wide selection of grocery and health and beauty care items. Price-impact warehouse stores include Food 4 Less and Foods Co.
KR also operates convenience stores, jewelry stores, and food processing plants. The company's 782 convenience stores offer a limited assortment of staple food items and general merchandise, and, in most cases, sell gasoline. Convenience store banners include Kwik Shop, Loaf N' Jug Mini Mart, Quik Stop markets, Tom Thumb Food Stores, and Turkey Hill Minit Markets. With 394 jewelry stores, the company is one of the largest U.S. jewelry retailers. Jewelry stores operate under banners such as Barclay Jewelers, Fred Meyer Jewelers, and Littman Jewelers. In addition, KR operates 42 manufacturing plants, consisting of 18 dairies, 11 deli or bakery plants, five grocery products plants, three beverage plants, three meat plants, and two cheese plants.
CORPORATE STRATEGY. Kroger aims to increase shareholder value through its dividend program and sustained earnings growth created by strong identical store sales, slight operating margin improvement, and continued share repurchases. At the beginning of 2008, the company held the number one or number two market share position in 39 of its 44 major markets, which consist of nine or more stores. The company strives to grow market share as this allows it to leverage fixed costs over a wider revenue base.
To generate identical store sales growth and market share gains, the company adheres to its Customer 1st strategy. This strategy focuses company efforts on improving employee communications and training; using customer research and loyalty data analysis to personalize stores on a market by market and store by store basis; improving customer loyalty by improving customers' shopping experience (improved convenience and accessibility through multiple store formats, store cleanliness and security, reducing checkout wait times, etc.); and pricing within an acceptable range of discounters' prices so that price becomes a neutral factor in customers' shopping decisions.
As an important part of its merchandising strategy, KR offers about 14,400 private label items. Products are sold in three tiers. Private Selection is a premium quality brand, designed to meet or beat the gourmet or upscale national or regional brands. The banner brand (Kroger, Ralphs, King Soopers, etc.) represents the majority of KR's private label items, and is designed to be equal to or better than the national brand. The Kroger Value brand is designed to deliver good quality at an affordable price. About 43% of corporate brand volume is manufactured in the company's plants.
FINANCIAL TRENDS. In the five years through FY 08, the company experienced a compound annual growth rate (CAGR) for revenues of 6.3%, reflecting increased same-store sales and square footage expansion. As of February 2008, the company was targeting EPS of $1.83 to $1.90 for FY 09, up 8% to 12% from operating EPS of $1.69 in FY 08. To achieve its EPS target, the company expects to achieve identical food store sales growth, excluding fuel sales, of 3% to 5%, and square footage growth of approximately 2.0% to 2.5%. KR expects capital expenditures for FY 09 of $2.0 billion to $2.2 billion, excluding acquisitions. The company reduced shares outstanding by 12% between 2003 and 2008. As of February 2008, $941 million remained under a $1 billion stock repurchase program that directors approved in January 2008.
Using the information above, answer the following questions. Please interpret statements by management cautiously -- do not take them as automatically true; at the same time, you don't have to ignore them, either.
1. (http://webpage.pace.edu/pviswanath/class/340/exam/spr08exa.html) Read the article below and the additional information provided to answer these questions:
Exxon's Stingy Capital Spending May Haunt It
April 16, 2008; Page B2, WSJ
Exxon Mobil Corp. doesn't make many mistakes. In the often-chaotic petroleum business, its careful budgeting and efficient operations are widely admired.
 But
Exxon's stingy approach to capital spending -- amid skyrocketing oil prices
-- could be a target of second-guessing for years to come. With crude
oil hitting a record above $113 a barrel Tuesday, the payoff for extracting
more petroleum is enormous. Until very recently, Exxon hasn't been sprinting
to win that race.
But
Exxon's stingy approach to capital spending -- amid skyrocketing oil prices
-- could be a target of second-guessing for years to come. With crude
oil hitting a record above $113 a barrel Tuesday, the payoff for extracting
more petroleum is enormous. Until very recently, Exxon hasn't been sprinting
to win that race.
Consider these numbers. In 2007, Exxon spent 5.3% of revenue on exploration
and capital outlays, down from 6.5% in 2003. The actual dollar amounts
did increase, to $20.9 billion from $15.3 billion. But they didn't keep
pace with Exxon's overall revenue growth, let alone soaring oil prices.
Crude climbed to about $92 from $34 a barrel during that period.
Meanwhile, the Irving, Texas, oil giant poured cash into stock buybacks. In 2007, Exxon repurchased $31.8 billion of its shares, up five-fold from the amount acquired in 2003. That activity helped earnings per share. It didn't increase oil output.
Wall Street analysts generally have cheered this financial conservatism, on the notion that big oil companies tend to waste money when they start drilling with too much gusto. But some now wonder if Exxon played it too safe. Benchmark Co. analyst Mark Gilman mutters about the company's "moribund" exploration program.
"Exxon has consistently been the most cost-disciplined of the big oil companies," says Morgan Stanley analyst Doug Terreson. "They most likely believe that the historic rise in oil prices isn't sustainable. Otherwise they would be spending a lot more than they have."
Exxon keeps a tight lid on its internal oil-price forecasts, but analysts say it has acted as if it wants to make sure its spending decisions still make sense in a world of $65 or even $40 per barrel oil. In moderation, such "stress testing" is an essential part of good budgeting. Taken to extremes, it can stifle almost any initiative.
Last month, Exxon finally announced a big boost in drilling efforts. Rex Tillerson, the company's chief executive, said exploration and capital spending for 2008-2012 were being raised at least 20% beyond previous forecasts. That amounts to outlays of more than $125 billion over that five-year period.
Part of the increase simply reflects higher costs for oil projects, Mr. Tillerson told analysts, as boom times send both labor and equipment rates soaring. But he also hinted at greater optimism within Exxon about what projects are worth pursuing. "Some things are moving ahead that we were not as prepared to put in the outlook last year," Mr. Tillerson said.
Exxon officials say they like their competitive position. Current or planned projects range from Greenland to New Zealand. They include a wide mix of conventional oil and gas, heavy oil, liquefied natural gas and deepwater initiatives. Spokesman Gantt Walton calls the company's resource base of 72 billion oil-equivalent barrels "the largest and highest quality in the industry."
Even with the cautious capital spending of recent years, Exxon has added reserves slightly faster than it has drawn them down. But making new projects pay off will take years.
What's more, countries such as Venezuela and Russia have become more assertive about the terms on which foreign oil companies can operate within their boundaries. That's made it harder for companies such as Exxon to roam the globe as profitably as they used to.
"So many places are off limits," says J. Bennett Johnston, a former Chevron Corp. director and senator from Louisiana who runs Johnston & Associates, a political-consulting firm in Washington. He contends that Exxon and other major oil companies are "going about as fast as they can."
Exxon isn't under any obligation to push every dollar of its sturdy profits -- $40 billion last year -- into dubious exploration efforts. But its recent strategy of focusing heavily on share repurchases can't go on forever, either. By some calculations, if Exxon sticks to its current buyback rate, its last share of publicly traded stock will disappear in 15 years.
Exxon's other big alternative could be to use some of those repurchased shares to finance a major acquisition. But at current oil prices, almost any logical target is far more expensive than it was a few years ago.
The company could just wait until oil prices stumble and acquisitions become cheaper. But the way energy markets are behaving, and the way global demand for energy keeps climbing, that could be a long, lonely vigil.
______________
Here is some additional information from various sources:
A: From Exxon's 10-K for 2007: Capital and Exploration Expenditures
| 2007 |
2006 |
|||||||||||
| U.S. |
Non-U.S. |
U.S. |
Non-U.S. |
|||||||||
| (millions of dollars) | ||||||||||||
Upstream (1) |
$ | 2,212 | $ | 13,512 | $ | 2,486 | $ | 13,745 | ||||
Downstream |
1,128 | 2,175 | 824 | 1,905 | ||||||||
Chemical |
360 | 1,422 | 280 | 476 | ||||||||
Other |
44 | — | 130 | 9 | ||||||||
Total |
$ | 3,744 | $ | 17,109 | $ | 3,720 | $ | 16,135 | ||||
| (1) | Exploration expenses included. |
Capital and exploration expenditures in 2007 were $20.9 billion, reflecting the Corporation’s continued active investment program. The Corporation expects annual expenditures to range from $25 billion to $30 billion for the next several years. Actual spending could vary depending on the progress of individual projects.
Upstream spending of $15.7 billion in 2007 was down 3 percent from 2006, mainly due to timing of project implementation and related expenditures. During the past three years, Upstream capital and exploration expenditures averaged $15.5 billion. The majority of these expenditures are on development projects, which typically take two to four years from the time of recording proved undeveloped reserves to the start of production from those reserves. The percentage of proved developed reserves has remained relatively stable over the past five years at over 60 percent of total proved reserves, indicating that proved reserves are consistently moved from undeveloped to developed status. Capital and exploration expenditures are not tracked by the undeveloped and developed proved reserve categories. Capital investments in the Downstream totaled $3.3 billion in 2007, an increase of $0.6 billion from 2006, as a result of new investment in China and higher environmental expenditures. Chemical 2007 capital expenditures of $1.8 billion were up $1.0 billion from 2006 due to increased investment in Singapore and China to meet Asia Pacific demand growth.
____________________
B: Further, in the Liquidity and Capital Resources Section in Exxon's 10K for 2007:
To support cash flows in future periods the Corporation will need to continually find and develop new fields, and continue to develop and apply new technologies and recovery processes to existing fields, in order to maintain or increase production. After a period of production at plateau rates, it is the nature of oil and gas fields eventually to produce at declining rates for the remainder of their economic life. Averaged over all the Corporation’s existing oil and gas fields and without new projects, ExxonMobil’s production is expected to decline at approximately 6 percent per year, consistent with recent historical performance. Decline rates can vary widely by individual field due to a number of factors, including, but not limited to, the type of reservoir, fluid properties, recovery mechanisms, and age of the field. Furthermore, the Corporation’s net interest in production for individual fields can vary with price and contractual terms.
The Corporation has long been successful at offsetting the effects of natural field decline through disciplined investments and anticipates similar results in the future. Projects are in progress or planned to increase production capacity. However, these volume increases are subject to a variety of risks including project start-up timing, operational outages, reservoir performance, crude oil and natural gas prices, weather events, and regulatory changes. The Corporation’s cash flows are also highly dependent on crude oil and natural gas prices.
The Corporation’s financial strength, as evidenced by its AAA/Aaa debt rating, enables it to make large, long-term capital expenditures. Capital and exploration expenditures in 2007 were $20.9 billion, reflecting the Corporation’s continued active investment program. The Corporation expects spending in the range from $25 billion to $30 billion for the next several years. Actual spending could vary depending on the progress of individual projects. The Corporation has a large and diverse portfolio of development projects and exploration opportunities, which helps mitigate the overall political and technical risks of the Corporation’s Upstream segment and associated cash flow.
__________________
C. Extract from website (http://www.maverickenergy.com/history.htm):
All of the oil world is divided into three: 1) The "upstream" comprises exploration and production; 2) The "midstream" are the tankers and pipelines that carry crude oil to refineries, and; 3) The "downstream" which includes refining, marketing, and distribution, right down to the corner gasoline station or convenient store. A company that includes together significant upstream and downstream activities is said to be "integrated".
____________________________
D. Information from Chevron's 10K for the financial year ended Dec. 31, 2007, issued on Feb. 28, 2008:
Capital expenditures for Chevron (as reported in the Consolidated Statement of Cashflows) were $16.678b, $13.813b and $8.701b in 2007, 2006 and 2005 respectively. However, including expensed exploration expenditures, assets acquired and Chevron's share of exploratory expenditures by affiliates, these same numbers worked out to $20.026b, $16.611 and $11.063b respectively for those three years. In fact, under the heading Capital and Exploratory Expenditures, this is what the firm's 10K statement had to say:
Total reported expenditures for 2007 were $20 billion, including
$2.3 billion for Chevron’s share of expenditures by affiliated companies,
which did not require cash outlays by the company. In 2006 and 2005, expenditures
were $16.6 billion and $11.1 billion, respectively, including the company’s
share of affiliates’ expenditures of $1.9 billion and $1.7 billion
in the corresponding periods. The 2005 amount excludes $17.3 billion for
the acquisition of Unocal.
Of the $20 billion in expenditures for 2007, 78 percent, or $15.5 billion,
related to upstream activities. Approximately the same percentage was
also expended for upstream operations in 2006 and 2005. International
upstream accounted for about 70 percent of the worldwide upstream investment
in each of the three years, reflecting the company’s continuing
focus on opportunities that are available outside the United States.
In 2008, the company estimates capital and exploratory expenditures will
be 15 percent higher at $22.9 billion, including $2.6 billion of spending
by affiliates. About three-fourths of the total, or $17.5 billion, is
budgeted for exploration and production activities, with $12.7 billion
of that amount outside the United States.
E. Sales and Revenue Income for several years (obtained from the 10K statement for 2007, in millions of dollars):
| 2007 | 2006 | 2005 | 2004 | 2003 | |
| Sales and Other Operating Revenue | 390,328 | 365,467 | 358,955 | 291252 | 237,054 |
| Earnings | 26,497 | 26,230 | 24,349 | 16,675 | 14,502 |
| Downstream | 9,573 | 8,454 | 7,992 | 5,706 | 3,516 |
| Chemical | 4,563 | 4,382 | 3,943 | 3,428 | 1,432 |
| Corporate and Financing | -23 | 434 | -154 | -479 | 1510 |
| Income from Continuing Operations | 40,610 | 39,500 | 36,130 | 25,330 | 20,960 |
| Cumulative effect of accounting change, net of income tax | 550 | ||||
| Net Income | 40,610 | 39,500 | 36,130 | 25,330 | 21,510 |
2. Investopedia shows you how you can get P/E ratios and other comparative information for firms industry-by-industry. If you follow their procedure for the Apparel Store industry (http://www.investopedia.com/offsite.asp?URL=http://biz.yahoo.com/p/industries.html), you can get comparables data. Assume you are comparing hte price-to-book ratios of the 13 largetst banks in the United States in 2000. The following table summarizes information on all the firms for which Yahoo provides data, excluding those for which data on P/E ratios and Debt/Equity Ratios are listed as NA (not available or not applicable):
Description |
Market Cap | P/E | ROE % | Debt to Equity | Price to Book | Net Profit Margin (mrq) | Price To Free Cash Flow (mrq) |
Citi
Trends |
286.82M | 20.38 | 11.089 | 0.022 | 2.078 | 6.226 | 40.142 |
Abercrombie
& Fitch Co. |
6.26B | 13.978 | 31.465 | 0.027 | 3.868 | 17.637 | 24.796 |
Wet
Seal Inc. |
331.94M | 15.652 | 18.662 | 0.028 | 2.592 | 6.799 | 39.681 |
Gap
Inc. |
13.41B | 17.388 | 18.353 | 0.044 | 3.132 | 5.668 | 17.988 |
Zumiez,
Inc. |
592.53M | 23.646 | 19.525 | 0.048 | 3.832 | 9.827 | 19.914 |
Cache
Inc. |
169.71M | 44.52 | 4.255 | 0.064 | 1.971 | -3.032 | NA |
Guess?
Inc. |
3.86B | 20.553 | 34.037 | 0.082 | 5.873 | 10.725 | 45.025 |
Foot
Locker Inc. |
1.98B | 38.994 | 2.146 | 0.097 | 0.87 | 5.735 | 13.341 |
Men's
Wearhouse Inc. |
1.26B | 9.011 | 18.735 | 0.113 | 1.551 | 2.769 | 27.683 |
Ross
Stores Inc. |
4.50B | 17.763 | 27.764 | 0.155 | 4.673 | 5.719 | 25.014 |
Stage
Stores Inc. |
523.05M | 11.014 | 9.719 | 0.193 | 1.004 | 6.691 | 7.817 |
Dress
Barn Inc. |
779.34M | 10.419 | 17.235 | 0.284 | 1.534 | 2.145 | 60.211 |
Casual
Male Retail Group, Inc. |
170.11M | 411 | 1.963 | 0.32 | 0.935 | 0.477 | NA |
Genesco
Inc. |
471.23M | 73.552 | 2.054 | 0.368 | 1.169 | 0.695 | 5.632 |
Jones
Apparel Group Inc. |
1.44B | 5.69 | 0.984 | 0.389 | 0.717 | 1.999 | -15.339 |
J.
Crew Group, Inc. |
2.94B | 31.32 | 133.032 | 0.891 | 20.93 | 6.24 | 42.092 |
Tween
Brands, Inc. |
466.40M | 10.426 | 18.567 | 0.897 | 2.386 | 7.908 | 7.503 |
Retail
Ventures Inc. |
240.75M | 5.464 | 152.795 | 0.913 | 1.392 | -27.816 | NA |
Limited
Brands Inc. |
6.01B | 9.328 | 27.754 | 1.312 | 2.748 | 11.874 | 6.751 |
Collective
Brands, Inc. |
659.07M | 15.819 | 6.087 | 1.312 | 0.937 | -5.999 | 35.434 |
Nordstrom
Inc. |
7.77B | 12.362 | 43.544 | 2.239 | 7.035 | 8.434 | 30.229 |
Apparel
Stores |
77.73B | 15.8 | 18 | 0.593 | 3.44 | 4.9 | 57.5 |
| Regression Statistics | |
| Multiple R | 0.575026 |
| R Square | 0.330654 |
| Adjusted R Square | -0.03444 |
| Standard Error | 16.0179 |
| Observations | 18 |
Coefficients |
Standard
Error |
t
Stat |
|
| Intercept | 26.04142 | 9.328261 | 2.79167 |
| Market Cap (in mils.) | -0.00055 | 0.001238 | -0.44228 |
| ROE % | -1.48137 | 0.893216 | -1.65846 |
| Debt to Equity | -3.26532 | 7.16697 | -0.45561 |
| Price to Book | 10.0126 | 5.448706 | 1.837611 |
| Net Profit Margin (mrq) | -0.32376 | 0.933526 | -0.34681 |
| Price To Free Cash Flow (mrq) | -0.08211 | 0.242584 | -0.33849 |
3. a. (10 points) According to Yahoo (http://finance.yahoo.com/q/ks?s=goog),
Google's beta as of Dec. 10, 2007 was 1.21. Assume that the market risk
premium was 6% per annum. The 10 year T-bond on that date yielded 4.15%
(http://finance.yahoo.com/). What is the rate of return that investors
should have required then, to invest in Yahoo, according to the CAPM?
b. ( 15 points) The Free Cash Flow to Equity for Google is $1.09b., according
to Yahoo (actually, this is Levered Free Cash, as defined at http://help.yahoo.com/l/us/yahoo/finance/tools/research-12.html).
This is the cashflow that Google had available to it, in 2006, after it
took care of its short-term and long-term investment needs, and after
adjusting for payments to and from bondholders. According to some researchers,
this could be considered a measure of how much the company could afford
to pay out in dividends. Google had, at that time, 312.84m. shares outstanding,
and it sold for $718.42 as of the end of trading on Monday, December 10,
2007. If you believe that Google's trading price is correct, what was
the implied rate of growth of dividends, assuming that Google would grow
at the same rate of growth forever? (Hint: If you use the usual formula
to compute the growth rate, you should get a surprising answer.)
c. (5 points) Does your answer make sense? If not, how would you change
your assumptions about Google's growth?