Industry Analysis and Top-down investing
The Business Cycle and Investing
Top-down investing involves looking at trends in the general
economy and then selecting companies likely to benefit from those trends.
Implementation:
Look at the case of the countries in the Asian debt crisis (see M. Freddie
Reiss, "Asian Markets" in Dominic DiNapoli, ed. (1999) "Workouts
and Turnarounds II," 279ff.). Look at the
case of Enron, or at the case of other companies that have
"inexplicably" crumbled. In many of these cases, it is clear
that the fundamentals were not reflected in the prices. This suggests that
if one had looked at the fundamentals, one could have sold out in
time. Of course, this represents a certain sort of market
inefficiency. But this is a market inefficiency that favors fundamental
analysis. If we can assume that the same applies for the upside as well
(that is, by looking at fundamentals, we can find stocks/sectors that are
under-priced), we should look at the fundamentals.
In order to reduce the order of difficulty of our problem, let us divide our
approach into two parts -- one, finding a sector/industry that is under-priced,
and then select stocks within those "under-priced" sectors that are
underpriced relative to the sector and relative to other stocks, as a whole.
Sector Selection:
How can we select sectors? In principle, there is no reason why our
approach to sector selection should be different from our principle to stock
selection. Although we are yet to discuss stock valuation and stock
selection, there are some basic principles that apply in both stock selection,
as well as sector selection. We could use those same principles to select
sectors. However, the difficulty with this approach -- one, we would need
to get a lot of information on cashflows, since the basic stock valuation
approach that we will use is cashflow based; and we will need a lot of
detail. Hence I will suggest an alternative approach.
We know that the economy is down quite a bit -- most of the statistics are
pretty bad. If we can agree that the economy is not likely to keep going
down in the medium term (in the short term, maybe), then, even if we do not know
when the upturn will occur, the sectors that will do well, when the upturn does
occur will be sectors that have the flexibility to capitalize on the new
opportunities. (And, actually, many of the measures of flexibility that we
will look at, will not hurt firms even if the economy continues going down.)
What aspects characterize a flexible firm? I can think of two -- one, a
low debt-equity ratio; and two, lots of free cashflow that are available to make
NPV>0 investments.
Cash flows:
Let's look at cash flows; let's see if there are industries that have a
high level of free cash flow. Whereas when the economy is flush, an excess
of free cash flow might lead firms to make bad investments, at times like these,
an availability of free cash flow is advantageous -- the firm/industry will have
cash when good investments become available. (Read article
on dividends from the Economist.).
In fact, we might refine this approach further. Perhaps there are
industries that already have investment opportunities -- admittedly, there are
not going to be many of these, but we can look! If such industries exist,
then their capital expenditures may very well be rising. Of course, if
these industries are already investing in profitable opportunities, why would
the market not reflect that in their prices already? After all, even if we
are positing a certain level of market inefficiency, let's not assume gross
inefficiency! On the other hand, it would not hurt to use this factor as a
secondary selection criterion. If we have sectors that are making
investments, this suggests that their free cashflow is probably not
increasing. In fact, if free cashflow is increasing, that might very well
indicate that the sector is experiencing accelerating problems.
So let's look at industries where capital expenditures are increasing and/or
high as well as industries where free cash flow is high and decreasing
(indicating, usage).
Leverage:
Firms with high leverage have to worry about paying off their debt or at
least servicing it. This does not give them much flexibility to capture
investment opportunities. Furthermore, debt, in general, and in these
times, in particular, is probably laden with restrictions and covenants.
Hence, if we want flexible sectors, we want sectors with relatively low leverage
ratios; industries with low debt/equity ratios
(relatively) or industries where debt-equity ratios have not increased relative
to their historic averages, or at least where they have not trended up.
Of course, we would need to look at debt levels/leverage relative to other
industries. Of course, since it's not possible to simply compare leverage
across industries -- the fundamentals are different, we need to do a
cross-sectional regression of leverage ratios. Perhaps use Damodaran's
cross-sectional regression model -- let's see if, perhaps there are
industries that tend to have below average leverage. Again, low relative
leverage suggests the ability to survive, as well as to the flexibility to raise
funds if necessary.
Implications of Market Efficiency for Capital Budgeting
Market Efficiency is usually assumed only for capital markets, because there
is relatively free flow of information. However, this is not assumed in
the market for real assets/projects. In other words, we assume that firms
can pick NPV>0 projects, even though, in general, we do not make that
assumption for (active) portfolio managers. However, this does not mean
that all projects will be NPV>0. Alan Shapiro has the following
insights (in an HBS article)
A project can be reliably identified as being positive NPV only if we can
also identify the sources of that positive NPV. In general, the sources of such
value enhancement represent some deviation from perfect competition in the
product market, such as the existence of barriers to entry in the firm's
industry, due to:
- the availability of economies of scale in production
Lesson: Investments that are structured to exploit economies of scale are
more likely to be successful than those that are not.
- the possibility of product differentiation
Lesson: Investments designed to create a position at the high end of
anything, including the high end of the low end, differentiated by a quality
or service edge, will generally be profitable.
- cost advantages
Lesson: Investments aimed at achieving the lowest delivered cost position
in the industry, coupled with a pricing policy to expand market share, are
likely to succeed, especially if the cost reductions are proprietary.
- monopolistic access to distribution channels
Lesson: Investments devoted to gaining better product distribution often
lead to higher profitability.
- protective government regulation
Lesson: Investments in project protected from competition by government
regulation can lead to extraordinary profitability. However, what the
government gives, the government can take away!
________________________
The Business Cycle and Stock Selection (From Robert Arnott (Chap. 9) in Investment Management by Bernstein
and Damodaran)
Leading Indicators also provide an interesting gauge. If leading
indicators have risen in the past year, typical of a recovery from a recession,
we find that heavily leveraged companies and labor-intensive companies are
likely to do well. Typically, during the recession that precedes an upturn
in leading indicators, most labor-intensive companies have already cut costs;
they enter the new economic cycle lean and well-positioned for the ensuing
economic recovery. Also when leading indicators have risen in the past
year, growth stocks have likely already made their move; accordingly, the value
stocks (high earnings-to-price stocks) would tend to do particularly well.
In each of these cases, we are not looking at coincident relationships, but
predictive relationships. One might surmise that the market would already
have incorporated this information into stock prices, but that seems not to be
the case.
________________________
Sectors and the Business Cycle
http://www.fidelity.com.hk/sector/funds/guide/economic.pdf
Why a sector emphasis?
http://www.fidelity.com.hk/sector/funds/guide/benefits.pdf
Practical Matters:
How do we define sectors? We can do it in several ways -- one we use
the S&P definition of sectors; two, we use the StockVal
definition.
S&P Sector Dynamics, Oct. 2001 from Fidelity
sector.pdf
Sector and Style Investing
http://www.investors-routemap.co.uk/Guidebook_sector_rotation.htm
________________________
Information in Different Textbooks:
Chapter 13 of Jones:
A detailed listing of business cycle contraction and expansion dates can be
found at http://www.nber.org. Go to http://www.smartmoney.com/economywatch/
to find a set of nine important economic indicators, including data on sales,
earnings, exports, prices, and jobs. Monthly statistics on the leading
indicators as well as other indicators can be found at http://www.yardeni.com.
The Federal Reserve Banks have numerous details on various aspects of economic
activity and all of them can be accessed through any of the regional banks, such
as http://www.frb.clev.org. A daily
commentary on economic activity can be found in the "Research,"
"Economics," part of Lehman's website at http://www.lehman.com.
Chapter 17 from Bodie, Kane and Marcus
Key Variables describing the macroeconomy:
- Gross Domestic Product (GDP)
- Unemployment Rate
- Inflation Rate
- Interest Rates
- Budget Deficit
- Sentiment
Classify shocks as demand shocks versus supply shocks. Demand shocks
are events that affect the demand for goods and services in the economy.
Positive demand shock examples are
- reductions in tax rates,
- increases in the money supply,
- increases in government spending
- increases in foreign export demand.
Supply shocks are events that influence production capacity and costs.
Examples are:
- changes in the price of imported oil
- freezes, floods or droughts
- changes in the educational level of an economy's work force
- changes in the wage rates at which the labor force is willing to work.
Demand shocks are characterized by aggregate output moving in the same
direction as interest rates and inflation, while supply shocks have the opposite
effect.
Consider a given scenario and identify which industries/firms would be
benefited by that scenario.
Section 17.5 on the Business Cycle.
Cyclical Industries have above-average sensitivity to the state of the
economy; they would outperform the market when the economy is improving.
Examples are producers are producers of durable goods, such as automobiles or
washing machines; other cyclical industries are producers of capital goods.
Defensive industries include food producers and processors, pharmaceutical
firms and public utilities. These industries will outperform others when
the economy enters a recession.
Leading indicators from the Conference Board are:
- Average weekly hours of production workers (manufacturing)
- Initial claims for unemployment insurance
- Manufacturer's' new orders (consumer goods and materials industries)
- Vendor performance -- slower deliveries diffusion index.
- Contracts and orders for plant and equipment
- New private housing units authorized by local building permits
- Interest rate spread, 10 year Treasury minus federal funds rate
- Stock prices, 500 common stocks.
- Money supply
- Index of consumer expectations.
Look at http://www.conference-board.org/economics/index.cfm
for information from the Chief Economist, The Conference Board.
Also, look at Aaron Gottesman's notes (c:\class\smip\macroeconomy_ag.ppt)
How to analyze companies and industries: Sites and Sources
Data on the service-sector is provided by (ISM) Institute for
Supply Management's manufacturing report
Because sector funds have a narrow focus, the sector fund investor should be
familiar with the factors that may affect the industry in question. Based on a
comprehensive analysis of the relevant facts, the investor must arrive at a
judgment as to what the industry's performance will be like going forward. One
technique commonly used by sector fund investors is to monitor the business
cycle for clues as to what may be happening in the market.
Business cycle basics
In its most classic form, the business cycle involves a recession giving way
to modest growth, then stronger growth. Eventually, growth reaches a peak, and
a slowdown begins, leading to recession and a completion of the cycle.
By examining empirical evidence, the investor can attempt to create a
framework for viewing present and future events as they unfold. There are two
key questions the investor may want to ask about historical empirical
evidence. First, will the historic pattern hold, or will it be altered? To
answer that, the investor needs to ascertain whether the factors driving
today's market are fundamentally unchanged, or whether the situation has
evolved incrementally or even been radically changed.
The second question is whether the market has already taken the anticipated
future events into account. If the factors driving the industry are the
traditional cyclical ones, the market usually will have taken them into
account, because they are expected. If the factors represent a new element in
the equation, then the market may not be expecting them and may not have
adjusted accordingly.
Business cycle and relative stock performance
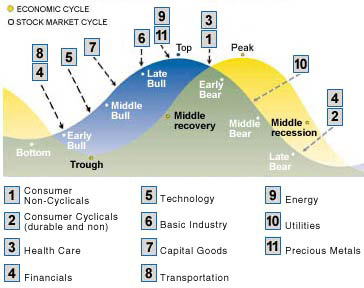
The following chart shows a typical business cycle and the points at which
various economic sectors tend to outperform the broader market. Click on any
number in the chart to learn about the cyclical characteristics of a
particular industry. Please note that the chart should be used for
illustrative purposes only. The chart is a historical representation of stock
performance movements relative to the business cycle and is not intended to
convey any current or future economic outlook.
Past performance is no guarantee of future results.
The chart above shows a typical business cycle and the points at which
various economic sectors tend to outperform the broader market. Please note
that the chart should be used for illustrative purposes only. The chart is a
historical representation of stock performance movements relative to the
business cycle and is not intended to convey any current or future economic
outlook. Choose a Sector for a detail description of its role in the business
cycle.
 Consumer
Non-Cyclicals
Consumer
Non-Cyclicals
Stocks in consumer non-cyclicals (food) and consumer growth industries
(cosmetics, tobacco, beverages) tend to experience fairly steady demand and
are less sensitive to changes in the business cycle. These stocks typically
attract investors when the economic cycle or bull market has matured, or is in
the early stages of contraction.
 Consumer
Cyclicals (durable & non)
Consumer
Cyclicals (durable & non)
Stocks in this category include durables and non-durables that are sensitive
to interest rates as well as the business cycle. Investors typically seek them
out when the economy is in the late stages of contraction.
 Healthcare
In general, stocks in this sector move similarly to consumer non-cyclicals.
This sector is considered defensive, meaning companies in this sector are
generally unaffected by economic fluctuations. The Healthcare industry
consists of pharmaceutical firms, HMOs, biotechnology firms and medical
equipment suppliers. Pharmaceutical companies are affected by competitive
market shares, the pace of FDA approvals, patent lives, and the strength of
the R&D pipelines. Many biotechnology firms are still in the development
stage with their fortunes largely determined by investor perceptions of the
relative merits of their R&D pipelines. With future new financing likely
to be more difficult to obtain than in the past, strategic alliances between
major drug companies and biotech firms are expected to increase.
 Financials
Stocks in housing-related industries tend to respond well to falling interest
rates and are often targeted by investors in the mid to late stages of an
economic contraction. Non-mortgage-dependent banks are generally driven by
commercial and consumer loan growth, and tend to be favored by investors
during the middle of the cycle.
 Technology
Technology stocks can be cyclical to the degree that they depend on capital
spending and business or consumer demand. However, they may also have
long-term growth potential as technological products find broader applications
and as new technologies are developed. Technology stocks are usually popular
during early to mid stages of an economic expansion.
 Basic
Industry
Basic
Industry
Profits of basic industries are driven by high utilization of capacity and
strong market demand for products. Therefore, their stocks tend to be popular
with investors late in an economic expansion. For basic material companies,
the global economic picture and supply/demand equation also affect stock price
movements.
 Capital
Goods
Capital
Goods
Capital spending tends to increase midway through the business cycle, as the
economy is heating up and higher demand for products leads companies to expand
their production capacity. Demand in global export markets is key for
agricultural equipment, industrial machinery, and machine tools.
 Transportation
Railroads and other surface carriers tend to react early to a pickup in the
economy. Airlines are subject to cyclical fuel costs, usage versus capacity,
and competitive pressures on airfares.
 Energy
This category includes large integrated international companies, domestic
exploration companies, and energy services companies. Each industry has its
own dynamics, but ultimately all are driven by the supply and demand picture
for energy worldwide. Political events have historically had a major impact on
these industries. Stocks tend to be popular with investors late in the
business cycle.
 Utilities
Electric companies have historically been very sensitive to interest rates
because of the large debt financing costs they must incur in order to build
their infrastructures. These stocks tend to perform well in an environment of
declining interest rates. Telephone companies may offer attractive long-term
growth opportunities, as they diversify and compete in recently deregulated
telecommunications markets.
 Precious
Metals
Precious
Metals
Precious metals and the stocks of companies that mine and process them can be
affected by industrial and consumer demand, but the largest factor
contributing to volatility in this category is generally inflationary
pressure. Investors often flock to this category late in the expansion cycle.
Signals to Look for During a Business Cycle
A business-cycle trough. The trough is usually
characterized by low earnings and high unemployment. When inventories start to
shrink, an upturn may be on the way.
A business-cycle peak. Typically, earnings
are high and unemployment is low at a peak. When prices for raw materials rise
and inventories start to increase, look for a downturn to follow.
A bull market. A bull market is characterized
by rising price-to-earnings (p/e) ratios and falling yields. In its late
stages, a bull market may see high initial public offering (IPO) activity,
rampant speculative buying, and outperformance from small-cap stocks. A market
that seems indifferent to good news and shows a strong concern over interest
rates may be at its top. Because the stock market usually anticipates the
business cycle, it may begin to slide even as good earnings are still being
reported.
A bear market. A bear market is characterized
by rising yields, falling p/e ratios, and sharp declines with heavy trading
volumes. A market bottom, however, may be marked by indifference to bad news,
sluggish performance, and widespread pessimism. Upturns are often gradual and
imperceptible. If the market anticipates the business cycle, earnings may
continue to be weak for some time.
Other factors
Factors outside the business cycle
In addition to evaluating sector performance relative to the business cycle,
sector investors should also evaluate factors that are external to the
business cycle, as they can also influence the short- or long-term behavior of
various industries' stocks. Some of these factors include:
Government policies. Recent examples include
high-tech antitrust cases such as Microsoft*, the auction of radio
frequencies, the move to reform healthcare, and the approval or denial of
biotech new product proposals.
International trade and competition. The
increasing globalization of the economy means that foreign activities can
affect American markets. For example, China's move toward acceptance as a
member of the World Trade Organization could have a major impact on U.S.
exports. Industries that are sensitive to imports or exports will also be
affected by changes in currency values.
International exposure. When evaluating
sector funds, it is also important to keep in mind that certain sector funds
may invest in foreign securities. Similar to any mutual fund, a sector fund's
exposure to international securities could magnify the overall risk of the
fund. A good example would be foreign government regulation in the healthcare
sector. While some drug companies have benefited by government deregulation,
heavily regulated pricing and government bureaucracy has hampered others.
Consumer demand. While some aspects of demand
are tied to the business cycle, demand can also follow changes in
demographics, fashions, price levels, or cultural concerns. Strong holiday
sales (or the expectation of them) can send retail stocks up. During the late
1990s, the emergence of the internet and the demand for access created new
markets for internet service providers and on-line retailers.
Innovation. The introduction of new products
and technologies can change the entire landscape of an industry. Examples
include the booming trend toward wireless communication, and developments in
biotechnology. While great investment opportunities abound, rapid product
development can also lead to the obsolescence of established products.