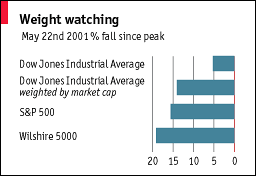
THIS week the Dow Jones Industrial Average came to within just 3.3% of its peak in January 2000. To judge by the average, the bears have retreated and equity losses have been all but restored. Was the past year just a bad dream?
Well, the Dow may be the best-known stockmarket barometer, but it is also the least reliable. It is a crude average of 30 share prices. In most other stockmarket indices, share prices are weighted by market capitalisation. When Charles Dow first published his index in 1896 there were no computers, so this crude method had advantages. He simply added up the various share prices and divided by the number of stocks. Over time the divisor has been adjusted to take account of stock splits.
A dollar increase in the share price of the biggest firm thus has the same impact on the Dow as a dollar increase in the share price of the smallest one. This is misleading, so The Economist has recalculated the Dow, weighting shares by their market capitalisation. On this basis, the Dow is still down by 14% from its peak. The broader market indices, such as the Wilshire 5000, are down by even more (see chart). In other words, investors’ portfolios have suffered bigger losses than looking at the Dow alone would suggest.
 |
The difference comes mainly because it is some of the larger companies that have seen the biggest falls in share prices. Microsoft’s share price is still 38% below its level in January 2000. Boeing, by contrast, has gained 50%—but in January 2000 its market capitalisation was just 7% of Microsoft’s.
At the stockmarket’s bottom in March, investors were comforted by the fact that the Dow had fallen by less than 20%, the conventional definition of a bear market. In fact, if it were weighted, the peak-to-trough decline would have been almost 30%: easily good enough for a grizzly.