The NPV method has several advantages:
However, there are other methods that are used and we will now consider their merits and demerits.
This investment rule specifies a certain number of years as a cutoff. All investment projects where the initial investment cannot be recovered in fewer years than the cutoff are unacceptable under this rule.
Thus, if two projects have the following cash flows:
| C0 | C1 | C2 | C3 | NPV at 10% | |
| Project A | -1000 | 800 | 150 | 250 | 39.06 |
| Project B | -2500 | 1200 | 1300 | 0 | -334.71 |
Then the payback period for project A is 3 years, while that for B is 2 years. If the cutoff is 2 years, project B will be accepted, while project A will not.
However, if we look at the NPV, project B is undesirable, while project A is desirable. Yet the payback rule give us precisely the reverse result. One reason for this is that the payback rule ignores the time value of money.How may the payback rule be justified?
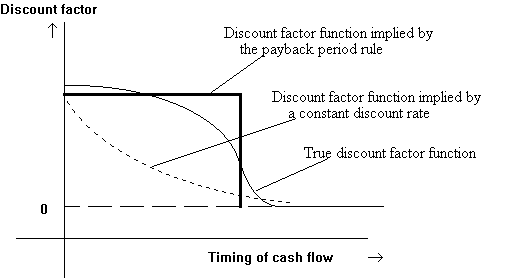
We usually assume that the same discount rate is applied to
all cash flows. Let di be the discount
factor for a cash flow at time i, implied by a constant
discount rate, r, where ![]() . Then (di+1)/di
= 1+r, a constant. However, if the riskiness of successive cash
flows is greater, then the ratio of discount factors would take
into account the passage of time as well as this increased
riskiness. In such a case, the discount factor may drop off to
zero more quickly than if the discount rate were constant. Given
the simplicity of the payback method, it may be appropriate in
such a situation.
. Then (di+1)/di
= 1+r, a constant. However, if the riskiness of successive cash
flows is greater, then the ratio of discount factors would take
into account the passage of time as well as this increased
riskiness. In such a case, the discount factor may drop off to
zero more quickly than if the discount rate were constant. Given
the simplicity of the payback method, it may be appropriate in
such a situation.

Another reason for such a discount function may be that the firm faces capital constraints, and outside funds are more expensive than internal funds. Hence funds generated by a project in a given year may be important in terms of providing for investment in other projects which may otherwise not be possible. This factor would not be reflected in a discount rate based on the 'market' rate of interest.
Finally, the method is very simple to implement.
A modified payback method looks at the cumulative discounted cash flows and requires that they exceed the initial investment in less than the cutoff number of years. This method does take into account the time value of cash flows occuring before the cutoff date. Consider the following two projects, A and B:
| C0 | C1 | C2 | C3 | C4 | |
| Project A | -1000 | 800 | 150 | 250 | 1000 |
| Project B | -1000 | 800 | 500 | 0 | 0 |
The discounted values of the cash flows are:
| C0 | C1 | C2 | C3 | C4 | NPV at 10% | |
| Project A | -1000 | 727 | 124 | 188 | 683 | 722 |
| Project B | -1000 | 727 | 413 | 0 | 0 | 140 |
The discounted payback of A is 3 years, while that of B is 2 years, but the NPV of A (at 10% p.a.) is $722, while that of B is $140.
Again, we have the wrong decision by using the discounted payback rule.
The discounted payback rule could be justified by an argument similar to the one used to justify the payback rule.
The ordinary payback is the time it takes to break even in an accounting sense (since the cash flows are not discounted). The discounted payback is the time it takes to break even in an economic sense.
Some companies judge investments based on their book rate of return.
To compute this, we calculate the average forecasted accounting profits and divided it by the average book value of the investment. This ratio is then compared to some industry average.
Consider the following project:
An initial investment of $9000 is made to purchase some assets; these are depreciated using straight line depreciation over 3 years to $3000; at the end of 3 years, the project terminates and the assets are sold at book value. The flows in each of the 3 periods are as follows:
| Year | 1 | 2 | 3 |
| Revenue | 12000 | 10000 | 8000 |
| Out of pocket costs | 6000 | 5000 | 4000 |
| Depreciation | 2000 | 2000 | 2000 |
| Profits before tax | 4000 | 3000 | 2000 |
| Tax at 25% | 1000 | 750 | 500 |
| Net Income after tax | 3000 | 2250 | 1500 |
| Cash flows | 5000 | 4250 | 3500 + 3000 |
| Book Value of assets at beginning of year | 9000 | 7000 | 5000 |
| Book Value of assets at year end | 7000 | 5000 | 3000 |
| Average Book Value | (9000+7000)/2 = 8000 |
(7000+5000)/2 = 6000 |
(5000+3000)/2 = 4000 |
The average book value equals ![]()
The average net income equals ![]()
The average return on book value is 2250/6000 = 37.5%.
The NPV (at 20%) is $1879.63.
Problems with the accounting rate of return method:
It depends heavily on how accountants determine costs. As we know, depreciation is not really an out of pocket cost, but it is treated as a cost by accountants; similarly, some items may be capitalized and others expensed according to non-economic rules. Hence the resulting profit number may be very different from the cash flows.
Can the accounting rate of return be justified?
Accounting rate of return numbers have to be computed anyway, and the data is easily available and is comprehensible.
The different projects encountered by the firm may be relatively similar in terms of their structure (e.g. depreciation), and accounting treatment. In such a case, if an industry or a firm benchmark is used, the resulting decisions are likely to be correct.
Consider a one period project requiring the immediate investment of $1000 and yielding $1200 at the end of a year. If the discount rate is 15%, the NPV is $43.48 and the project should be accepted. We could, alternatively compute the rate of return on the project, which is clearly (1200-1000)/1000 = 20%. Since this is greater than the 15% cost of capital, the project would be accepted under this criterion. This rate of return criterion always yields the same answer as the NPV method for one-period projects.
The problem with using this method for multi-period projects is that there is no obvious definition of return in these cases. One common way is to define the rate of return such that the NPV of the project, using that rate as the discount rate, is zero. The resulting rate is called the Internal Rate of Return (IRR). If the discount rate were exactly equal to the IRR, the project would be marginal. Accepting the project would neither add to nor reduce the value of the firm. If the NPV is increasing in the discount rate, then this means that all projects with an IRR greater than the discount rate should be accepted; and rejected otherwise. For example, take the following project:
| C0 | C1 | C2 | C3 |
| -9000 | 6000 | 5000 | 4000 |
The IRR can be computed as the solution to:
![]()
This works out to approximately 33%. If the discount rate is less than 33%, the project should be accepted.
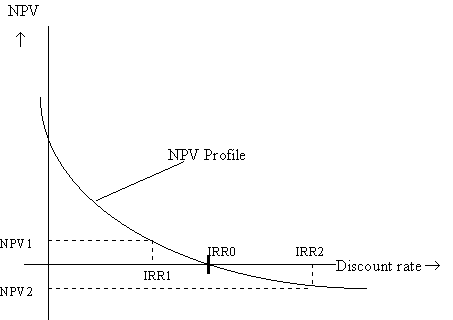
For each discount rate, we could compute the NPV of a project (the RHS of the above equation in that example). Graphing each of those NPV values against the discount rate (call this the NPV profile), we would have a downward sloping curve (under the right conditions). The point where this curve crosses the X-axis is the IRR (IRR0). It is easy to see that if the cost of capital is less than the IRR (IRR1), the NPV will be positive at that discount rate. If the cost of capital is greater than the IRR (IRR2), the NPV will be negative at that discount rate. Hence the IRR rule will give the same (correct) answer as the NPV rule if the NPV profile is downward sloping.

Investing or Borrowing?
We noted above that the IRR rule produces the same result as the NPV rule if the NPV profile is downward sloping. However, this does not always happen, especially if there are cash outflows during the life of the product.
| Year | 0 | 1 | 2 | 3 | 4 | 5 | IRR |
| Project 1 | -1000 | 200 | 200 | 300 | 350 | 500 | 13.96% |
| Project 2 | 1000 | -200 | -200 | -300 | -350 | -500 | 13.96% |
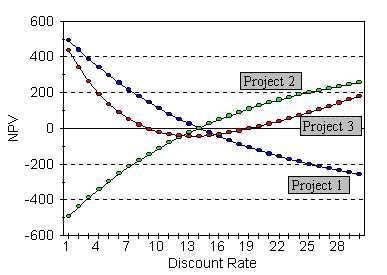
| Project 3 | 400 | 0 | 11000 | -8800 | -26250 | 24200 | 8.80%, 19.22% |

Project 1 above is a typical investment project. The cash flow is negative in period 0, and positive in future periods. The NPV profile is downward sloping, and the IRR rule works; i.e., if the discount rate is less than 13.96%, the project will be accepted, which is the correct rule.
Project 2 is a typical borrowing project. In this case, the initial cash flow is positive (the amount borrowed), and the succeeding cash flows are negative (the repayment schedule). In this case, we can easily modify the IRR rule in a commonsensical fashion:
We accept the project if the IRR (the implicit interest rate) is less than the discount rate. That is, if the discount rate is greater than 13.96%, we accept the project, since this implies that we are able to borrow more cheaply than in the market.
Project 3, however, is problematic: the cash flow in period 0 is positive, like a typical borrowing project; however, succeeding cash flows are not all negative. Which IRR rule do we apply, the rule for a typical investment project or that for a typical borrowing project? Looking at the NPV profile, we see that neither rule works all the time. In fact, in this case, the project is to be accepted if the discount rate is less than 8.80 or greater than 19.22.
At a discount rate of 8.80% (the first IRR), the NPV profile is downward sloping like a typical investment project, and hence the usual IRR rule applies. At a discount rate of 19.22% (the second IRR), the NPV profile is upward sloping. Hence the project is more akin to a borrowing project, and hence it is to be accepted if the discount rate is greater than the IRR.
We have assumed, in our application of the IRR, that the discount rate is the same for cash flows in all periods. What do we do if this assumption is not satisfied? Suppose ri, the discount rate for cash flows occurring in year i is not the same for all i. The NPV rule does not change, even in this case; we accept projects with positive NPV. However the NPV is computed according to the general formula:
![]()
On the other hand, there is no simple generalization of the IRR formula. The IRR rule requires us to compare the IRR with the appropriate discount rate. However, when the discount rate ri varies from one period to another, do we compare the IRR with r1, r2, or r3? The answer is, none of the above. Rather, the IRR is to be compared with the market rate of return on a security that is similar in the time pattern of cash flows. However, this is a much more difficult task.
The main difficulty with the IRR is that it is not an economically meaningful concept, like NPV (which is today's dollar equivalent of the project).
Hence, it cannot be manipulated according to economic logic. Thus, while NPV(A+B) = NPV(A) + NPV(B),
IRR(A+B) IRR(A) + IRR(B), or indeed any other simple function.
The problems that this causes can be seen in the following cases:
Scale:
The IRR can be likened to an average rate of return per dollar invested. Project A may have a better IRR than project B, say 20% versus 10%. However, if only $1000 can be invested in project A while $100,000 can be invested in project B, the net dollar return from A may be smaller than that from B. Hence provided the cost of capital is less than 10%, it may be optimal to accept B and reject A.
The Time Pattern of Cash Flows:
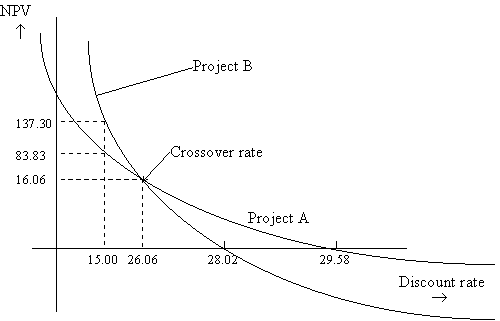
Even if the NPV profiles for two projects are downward sloping, they may slope downwards at different rates. Consider the projects shown below. Project B is superior to project A (in terms of NPV) if the cost of capital is less than 26.06%, whereas if the correct discount rate is greater than that, project A has a greater NPV. If we use the IRRs of the two projects as measures of their relative worth, project A seems to be unambiguously better than project B, which we can see is not the case if the cost of capital is below 26.06%.
| Year | 0 | 1 | 2 | 3 | 4 | 5 | 6 | IRR |
| Project A | -200 | 75 | 75 | 75 | 75 | 75 | 75 | 29.58 |
| Project B | -300 | 75 | 75 | 112.5 | 150 | 150 | 187.50 | 28.02 |

One way to salvage the IRR rule under these circumstances is to transform the question from a choice between two projects to a single project choice. This can be done as follows: Choosing between A and B is akin to choosing A and then asking oneself the question--should I switch to project B or not? The cash flows for this quasi-project are simply the difference between the cash flows for project B and the cash flows for project A. If the IRR for this switch project is greater than the appropriate discount rate, we should switch (i.e. accept project B); if not we should not switch (i.e. accept project A).
Example:
| Year | 0 | 1 | 2 | 3 | 4 | 5 | 6 | IRR | NPV@ 29% |
| Project A | -200 | 75 | 75 | 75 | 75 | 75 | 75 | 29.58 | 2.5 |
| Project B | -300 | 75 | 75 | 112.5 | 150 | 150 | 187.5 | 28.02 | -7.54 |
| Switch Project (B-A) | -100 | 0 | 0 | 37.5 | 75 | 75 | 112.5 | 26.06 | -10.04 |
If the cost of capital is 29%, we do not accept B-A; i.e. we stay with project A (which has the higher NPV).
Note that the IRR for the switch project is equal to the cross-over rate.
The profitability index is defined as PI = -PV/C0. This technique attempts to adjust for capital rationing. For a single project, it is obvious that the PI rule leads to the same decisions as the NPV rule.
However, if projects are mutually exclusive, and we cannot accept fractions of projects, this can lead to the same scale problems as the IRR rule.
| C0 | PV(C1,..,Cn) | PI | NPV | |
| Project A | 200 | 240 | 1.2 | 40 |
| Project B | 1000 | 1100 | 1.1 | 100 |
Suppose we have 1000 dollars available today for investment. Then, the optimal strategy is to choose project A and 80% of project B. This yields an NPV of 40+0.8(100) = 120. However, if projects are indivisible, then it is preferable to take Project B, and forego Project A altogether, even though it has a higher PI. Hence the PI strategy tells us the optimal order in which to accept projects, if there is capital rationing, assuming that projects are divisible.
Danforth and Donnalley Laundry Products Case
In the previous chapters, we saw that the Net Present Value method maximized the value of the firm. We then discussed different techniques of capital budgeting. We are now ready to apply these lessons to evaluating the specific capital budgeting problem that we considered earlier-- Danforth & Donnalley Laundry Products Company.
(See your instructor for the solution.)Go
to previous chapter
Go
to FIN 301 Home Page
Go to P.V.
Viswanath's Home Page