| |
Lubin School of Business
FIN 632: Intro to Financial Decision Making
Prof. P.V. Viswanath
Fall 2013
Final
- The exam is closed book. No worked out examples, nothing.
- Time allowed is 2 hours.
- Explain all your answers; correct answers without explanations may not be given any credit at all. Make sure you do not use more space than the question allows you.
- Make sure that your answer is clear and concise. Confused and rambling answers will lose points.
- If you answer a question, I have the discretion to award you some points, even if you are completely wrong. If you don't attempt the question at all, I can give you no points! So attempt every question.
-
- (10 points) According to the CAPM, what is the most important measure of riskiness of an asset? Provide an explanation, no longer than half a page, for your answer.
- (5 points) Why might the Fama-French-Carhart model be preferred to the CAPM?
- (10 points) Suppose I have historical data on the return on Sprint Corporation for the last 15 years. I believe that the distribution of returns on this stock in the future will be similar to its past behavior. I want to forecast the return on Sprint Corporation for the next year using only the history of its past returns. My friend wants to forecast the average return on Sprint Corporation over the next five years, again using only the history of its past returns. Whose forecast will be more precise -- in the sense of a lower confidence interval -- mine or my friend's? Explain.
- You have figured out the following table of scenarios for the return on your favorite stock for the following year.
- (5 points) What is the expected return on this stock?
- (10 points) What is the variance of returns?
| Probability |
Return |
| 0.1 |
10% |
| 0.2 |
2% |
| 0.3 |
-5% |
| 0.4 |
3% |
- The following bonds are available. Assume face value is $1000.
| Bond |
Maturity |
Coupon |
Price |
| A |
1 |
0% |
943.396 |
| B |
2 |
0% |
873.439 |
| C |
3 |
5% |
924.366 |
- (10 points) What is the term structure of interest rates?
- (10 points) What would be the price of a 10% coupon 2 year bond today, assuming there are no arbitrage opportunities?
- (10 points) What is the one-year forward rate one year forward and two years forward?
- (10 points) If you believe that all liquidity premiums are equal to 1%, what is your estimate of the price of a one-year zero coupon T-bill, one year from now?
- (10 points) The annualized yield on a 4-week (28 day) T-bill issued on 12/19/2013 and maturing on 1/16/2014 was 0.010%, according to the Treasury's website, http://www.treasurydirect.gov/instit/annceresult/annceresult.htm. What would the price of a T-bill with a face value of $1,000,000 be?
- (15 points) Here's the yield curve for Great Britain for 9th February, 2005, as viewed on a Wikipedia image:
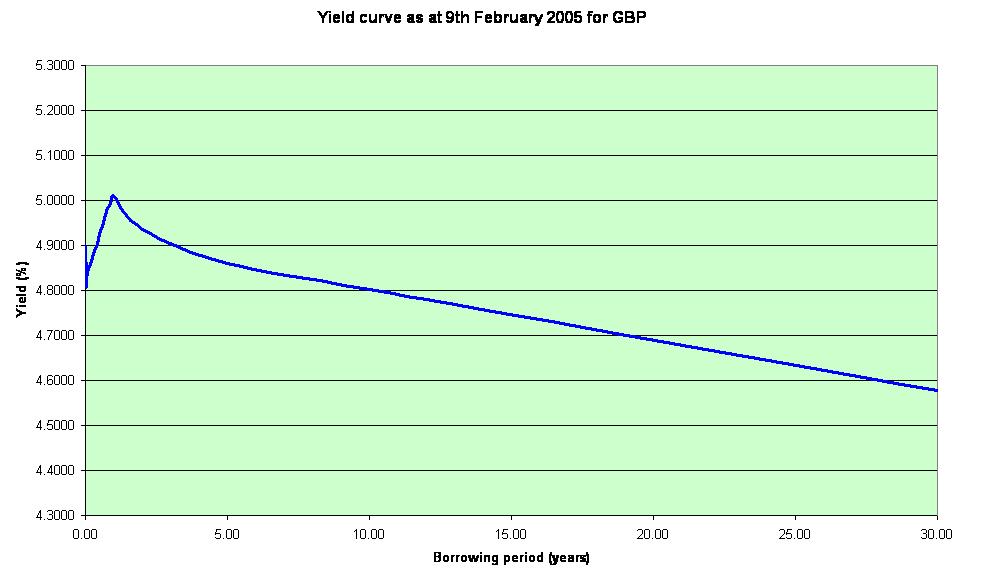
Come up with a forecast regarding interest rates for the next ten years. Explain and justify any assumptions that you have made. Do not use more than half a page for your answer.
- (Bonus, 5 points)) What is the difference between a market order and a limit order?
Solutions to Final
1.
- According to the CAPM, the most important measure of riskiness of an asset is the asset's beta. All other sources of risk can be diversified away and hence they don't matter.
- The Fama-French-Carhart model might be preferred to the CAPM for two reasons -- one, it allows for multiple sources of risk to matter, independently; two, it seems to provide a better empirical fit to the data.
- My friend's forecast will be more precise, because returns over different periods of time are more-or-less independent. As a result, the average return over a longer period of time can be predicted more precisely. Higher returns over one period will be more likely to be offset in another period of time.
2. The expected return is 1.1 percent; the variance is 20.69, the standard deviation of returns is 4.549%.
Prob. |
Return |
R - E(R) |
(R-E(R))^2 |
| 0.1 |
10 |
8.9 |
79.21 |
| 0.2 |
2 |
0.9 |
0.81 |
| 0.3 |
-5 |
-6.1 |
37.21 |
| 0.4 |
3 |
1.9 |
3.61 |
| Exp Ret |
1.1 |
Var |
20.69 |
|
|
Std Dev |
4.548626 |
3.
- y1 = 1000/943.396 -1 or 6%; y2 = (1000/873.439)0.5-1= 7%.
Coupons on the 3 year bond are
$50 in each year; present values of these payments using the appropriate yields are 50/1.06 and 50/(1.07)2 or $47.17 and 43.67. Subtracting these amounts from the price of Bond C, we get 924.366 - 47.17 - 43.67 = 833.526. y3 = (1050/833.526)(1/3)-1= 8%. Hence the term structure is y1 = 6%; y2 = 7% and y2 = 8%.
- The price of a 10% 2-year coupon bond today would be 100/1.06 + 1100/(1.07)2 = $1055.12.
- The one-year forward rate one year forward is (1.07)2/1.06 - 1 = 8.01%; the one-year forward rate two years forward is (1.08)3/(1.07)2- 1 = 10.03%.
- If all liquidity premiums equal 1%, then the expected short rate one year from now would be the one-year forward rate one year forward less 1% or 8.01% - 1% = 7.01%. Hence the price of a one-year zero coupon T-bill would be 100/1.0701 = $93.449 per $100 of par.
4. The yield is defined as 365/28 of the actual 28-day yield; hence the actual 28-day yield equals 0.010(28/365) i.e. 0.0007671. Hence the price would be 1000000/1.0007671 or $999,233.46
5. The yield is 4.8% on very short-term instruments, about 5% on a 1-year bond, 4.85% for 5-year bonds, 4.8% for a 10-year bond and lower for bonds of higher maturities. If we assume that the expected real insterest rate is constant and that there are no liquidity premiums, this suggests a increase in the short rate in the near future, followed by an eventual decrease in short rates over time. However, empirically speaking, an inverted yield curve like this one suggests that there will be a recession and that real rates will drop in the future. This suggests that the market expects nominal rates to drop even more precipitously. With a depressed economy, there will be no demand for investable funds and the equilibrium interest rate will be very low.
6. A market order is one that has to be filled immediately at the best possible price. A limit order is one that is filled at a price equal to or better than the price specified in the order. Hence, if the current price is $20 and there is a market order to sell, it should be sold at $20. If there is a limit sell order with a specified limit price of $25, it should not be sold right now; the broker should wait until the price hits at least $25 before selling. |
|