|
Dr. P.V. Viswanath |
| Home/Courses/Articles | ||
Exchange Rate Exposure |
|||||||||||||||||||||||||||||||||||||||||||||||||||||||||||||||||||||||||||||||||||||||||||||||||||||||||||||||||||||||||||||||||||||||||||||||||||||||||||||||||||||||||||||||||||||||||||||||
| P.V. Viswanath, 2005
Translation Exposure:(This section follows an excellent treatment by Reid W. Click and Joshua
Coval, "The Theory and Practice of International Financial Management,"
Prentice Hall, 2002, Chapter 6) The method prescribed by FASB-52 is known as the current rate method. Under this method, all assets and liabilities on the balance sheet are valued using the exchange rate prevailing on the date of the balance sheet statement. All items in the equity account are translated at their appropriate historical rates, which were in effect when they were originally posted to the balance sheet. This transfers the impact of the exchange rate to the equity account. Since all items are translated at the current rate, the net exposure is simply the difference between total assets and total liabilities, i.e. the equity account. This is the only account that is assumed to be a long-term investment at risk. One problem with this approach is that this could cause extreme variability in the net income figure. If we assume that exchange rate changes are transient, this would unnecessarily give an impression of a volatile business. To avoid this, FASB-52 prescribes that translation gains and losses shoudl bypass the income statement and be accumulated in a separate equity account in the balance sheet, called a "cumulative translation adjustment." However, if the foreign business is sold or discontinued, then the translation gains and losses are recognized. Consider the following example; for simplicity, in this example there are no additional retained profits from one year to the next and the balance sheet remains unchanged. This allows us to focus on the impact of exchange rate changes on the balance sheet, without worrying about the income statement.
The amount of translation exposure is, therefore measured simply as the difference between total assets and total liabilities. How to deal with profits during the year:
As shown in the example above, the translation adjustments are accumulated over time, until an activity is sold or disposed of. Accountants, therefore, need to keep records on all the historical exchange rates at which the items in the capital account are translated. It should be clear, then, that to construct a balance sheet in home currency units, the only information required is the beginning-of-period balance sheet in home currency units and the beginning-of-period exchange rate, the period's retained earnings and the average exchange rate, and the end-of-period exchange rate. In this case, a continuing translation exposure is created during the year, as the firm generates profits, which will be recognized in the income statement using an average exchange rate for the year, while they will be incorporated into retained earnings using the end-of-period exchange rate Exceptions to the Principal Features of FASB-52 Case 1: In certain cases, foreign operations are considered not to be self-contained units. Here are two examples -- one, where a foreign operation that functions as just a sales office for the parent simply imports goods and sells them in the foreign market. In this instance, the operation is clearly an integral part of the parent's operations. The second case is that of re-export facilities located abroad. If the nature of the operation is to import inputs from the parent, perform some light manufacturing or assembling, and re-export finished products to the US, then the operation is considered an integral part of the parent's operations. Case 2:If a firm's operations are located in highly inflationary countries, then the local currency is not a very effective functional currency. Revenues and costs measured in such a local currency and translated into dollars using a given exchange rate are unlikely to reflect the true dollar value of operations. In these two cases, FASB-52 provides for translation of the financial statements using the temporal method, in which all monetary assets and liabilities are translated at the current exchange rate and non-monetary assets and liabilities are translated at historical exchange rates. The main difference between this method and the monetary/nonmonetary method is that inventory is considered a monetary asset if it is valued on the balance sheet at market value but is considered a non-monetary asset if it is value at historical cost. The main implication is that foreign exchange gains or losses associated with monetary assets and liabilities are considered to have an important impact on the parent company's value, and they recorded in the income statement as they occur. In the case of an inflationary country, it would again not make sense to carry translation losses in a "temporary" account in the balance sheet, since they are not really temporary -- the local currency would be expected to consistently depreciate. In these two cases, currency gains and losses are considered imoprtant components of doing business in a given time period, and are therefore to be realized as they occur. Leading and Lagging: Used for:
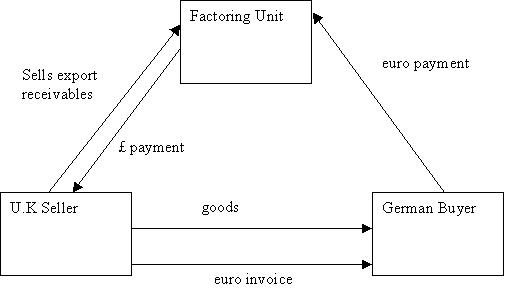
Netting: Exposure netting does not involve actual netting. Rather, if there is the potential for actual netting, then there is no real exchange exposure, whether or not the netting is actually done. Hedging can be done through selective use of the invoice currency. Thus, if invoicing is done in the stronger currency (or the home currency, as may be relevant), there is no exchange rate exposure.
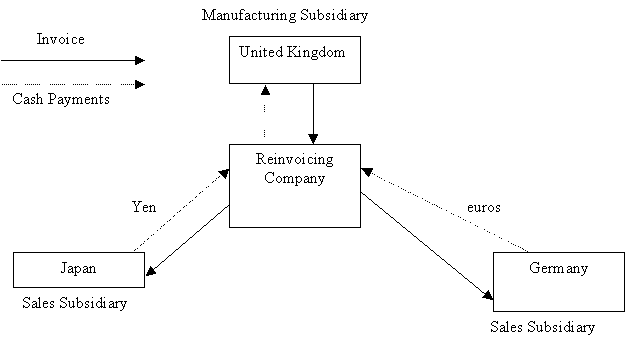
Reinvoicing Center:
Transactions Exposure
Operating ExposureThis note is based, partially, on Eugene Flood and Donald R. Lessard,
“On the Measurement of Operating Exposure to Exchange Rates: A Conceptual
Approach,” Financial Management, Spring 1986.
Information re contractual exposure can be found in the firm’s
financial statements – not so, operating exposure. The exposed items
are future revenues, costs, and profits. The impact of the firm’s competitive position on its operating
exposure: Market structure will determine:
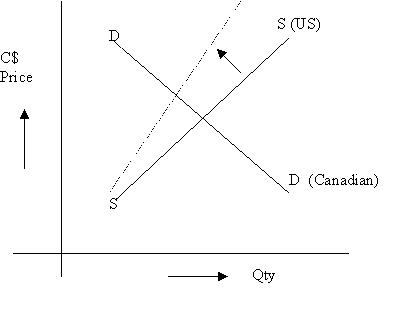
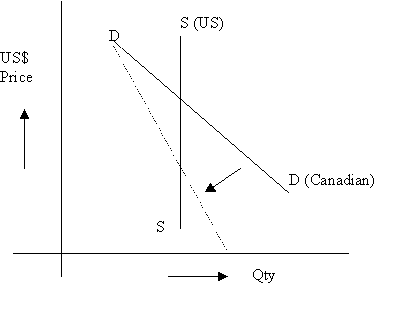
Currency Habitat: Assume Perfect Competition and Law of one price. Assume the lumber industry. Suppose the marginal producers and consumers are in the US; then the US$ will be the natural currency. If the Canadian currency depreciates 10%, the US$ price will remain constant; the Canadian price will have to increase 10% because the dollar revenue from any sale will have to remain the same; the dollar price must remain the same. Hence the Canadian price times the exchange rate must remain the same. If the C$ depreciates, for this to happen, the Canadian price must rise. Thus, even if you had a company that invoiced in C$ and sold to Canadian customers, it would have no exchange rate exposure. In the above two cases, the natural currency price is not affected by
the exchange rate change. Both marginal producers and consumers are in
the same country and the exchange rate is extraneous to the determination
of the natural currency price. Now, however, let us consider a case where
supply/demand elasticities are relevant.
Note that in this case, the depreciation in the C$ causes the Canadian $ price to rise, but it will not rise by the same amount as the depreciation. The quantity sold will drop, as well. Whether the revenue will rise or drop will depend on the price elasticity of demand.
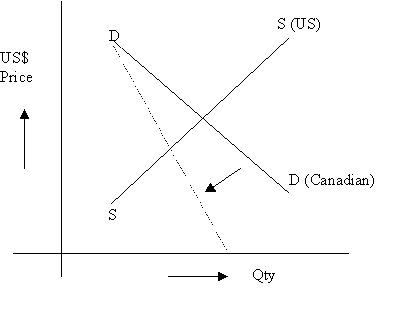
In the figure above, the supply curve remains constant because it is presented in US$. However, the demand curve will change. At each US$ price, the C$ price is higher, hence the amount demanded by Canadians will be lower. In this case, the price in US$ will drop; however, the price drop will be less than the percentage depreciation in the Canadian $. The net result, therefore, depends on two factors: one, the extent to
which the law of one price holds, and two, the relevant demand/supply
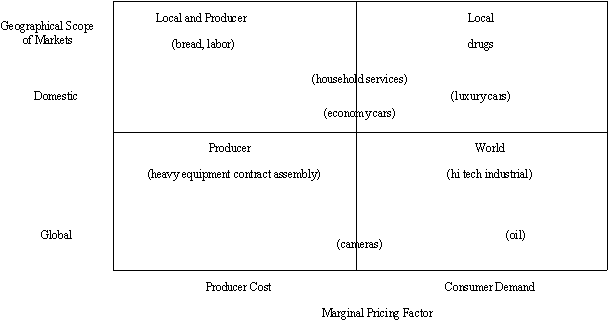
elasticities. This can be seen in the following table. The y-axis indicates the extent of application of the law of one price. The upper half indicates contexts where the law of one price holds to a lesser extent, and hence firms face local-currency denominated marginal revenue curves. The x-axis indicates the marginal pricing factor. This reflects the relative importance of producer cost and consumer demand considerations that depend on, inter alia, the competitive structure of the industry, the price elasticity of demand, the range of complements and substitutes and the relevant cross-elasticities, and the structure of costs. This last refers to operating leverage. If operating leverage is high, marginal considerations are less important and pricing is dictated primarily by demand considerations. Alternatively, we can think of the marginal pricing factor as indicating situations where supply elasticities are more important that demand elasticities, while at the right end of the axis, the reverse is true.
Suppose we have a US firm selling luxury cars in France. If we accept the assumption that luxury car pricing is likely to be local and does not respond to international effects, exchange rate fluctuations are not likely to affect local pricing to any great extent. This may be, for example, because local firms will not respond to exchange rate driven changes in operating costs. Furthermore, because of the cost structure of the car industry, local demand considerations will be paramount in pricing. Hence, even if the local currency depreciates, the US firm is likely to have to keep the local price constant. As a result, the currency depreciation will flow through, pretty much, to the revenues of the US firm. On the other hand, the local price of oil is likely to adjust to worldwide
impacts in oil prices.
|
|||||||||||||||||||||||||||||||||||||||||||||||||||||||||||||||||||||||||||||||||||||||||||||||||||||||||||||||||||||||||||||||||||||||||||||||||||||||||||||||||||||||||||||||||||||||||||||||